


Communication is key
Introducing Brokers, may or may not have an online presence but are typically actively involved in communication with their network. Depending on their direct activity and location, they may or may not be required to have various forms of licensing or registration with regulators or authorities for the safe-guard of traders & investors.
Typically, an IB has a deeper, more established track record in the trading / investing space. Some may be or have been, traders themselves, but have an established community that is focused on trading and/or investing. While you work on building your network and community, you will be sensitive towards building and maintaining:
Trust
Credibility
Authority
Not just with your audience but also with the brokerage firm(s) you work with. As a successful IB you will work steadily to improve your business and not sporadic portfolio activity. What will that look like?
Your network is your net worth
Work harder and smarter to build long-term relationships and not one-off referral fees. This will show commitment to the process and journey.
Have a clear understanding of your niche, and provide support/ tools that are relevant. Whether your focus is on retail traders, beginner, professional, region specific or other and make sure you “speak the same language.”
If you have online presence, follow best practices for your page and support this with offline visibility at relevant Trading expos and Finance events where traders and Introducing brokers meet (you can visit our full calendar here). Make the most of your proximity and build opportunities for meetups, workshops and seminars that encourage smart and safe trading & investing.
Work towards improving portfolio quality
As you build your community, you will want to simultaneously work towards improving the quality of your network. Client count does not necessarily mean a valuable portfolio.
What do brokers consider a high-quality portfolio of their Introducing Brokers?
- Active traders rather than “dormant” accounts
- Clients who understand risk and who are educated on the nature of the market
- Clients who are aligned with the broker’s product offering
Reputation can make or break networks. Evaluate carefully prior to committing both money & time to a partnership.
What does a good partnership look like?
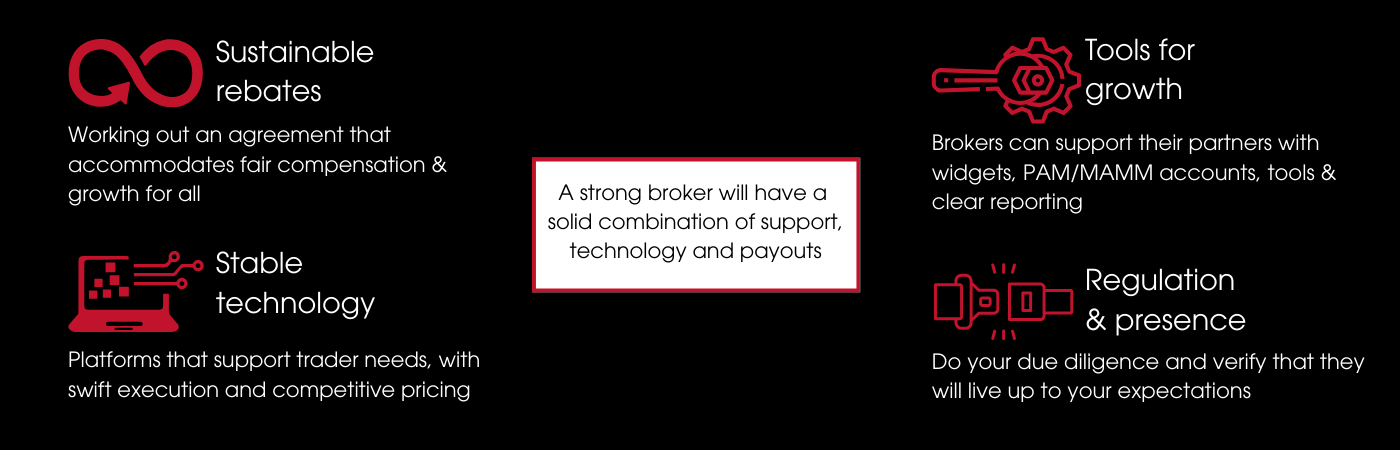
Ensuring the above is in place you will be working towards higher LTV (lifetime value), lower churn (loss of portfolio), and more stable income.
“Show me the money”
As an IB, depending on the network you are cultivating, and the traders you are working with, various types of commission structures will be at play.
A broker’s model spans between a-book and b-book (or hybrid), allowing for specific commission structures or affect payout flexibility.
The more you understand the nature of your traffic, and communicate this well in advance, the less friction later in the relationship with the broker.
Rebates
A dollar amount per lot traded by your clients
CPA
A dollar amount per funded account
Multi level
Payout per lot traded by your sub-IB clients
Rev share
A percentage of total P&L of business referred
Hybrid
A mix of programs (ex. CPA + Rev share)
Building your presence
If you are more heavily focused on offline business, an online presence is becoming critical when it comes to growth.
Between the conversations and interactions that you have with your trading network, having a reference point online can support you in the following ways:
- Build credibility (you are who you say you are). This can be via a website or social media profiles (LinkedIn, Instagram for example).
- Social media can give you an additional way to keep relationships warm between direct interactions.
- Providing educational content or resources can work as a support for your network at their own pace.
Have you grown your network to a point where you can do more?
Take advantage of our free resources
for your beginner traders

And keep growing the momentum
with our advanced material
Latest news and prices
for beginner to advanced traders
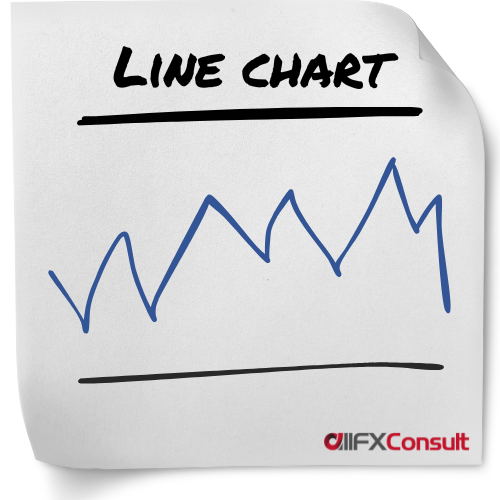
Line charts are also called close-only charts and for good reason. They take the closing prices of a given period, connect the consecutive points and create a line to represent their move.
Technical analysis today needs to be as accurate as possible, and a line chart doesn’t give the details of a trading session.
Many analysts favour line charts for their simplicity, since they regard the closing price of a session as the most important information to know. Dow (from Dow Jones) was one of these analysts.
Although more detailed charts are favoured by most, they can get really cluttered and don’t allow traders to spot events like a tight divergence.
Line charts display a clear trend direction, chart patterns and they can spot support/resistance levels, sometimes more accurately than other chart types.
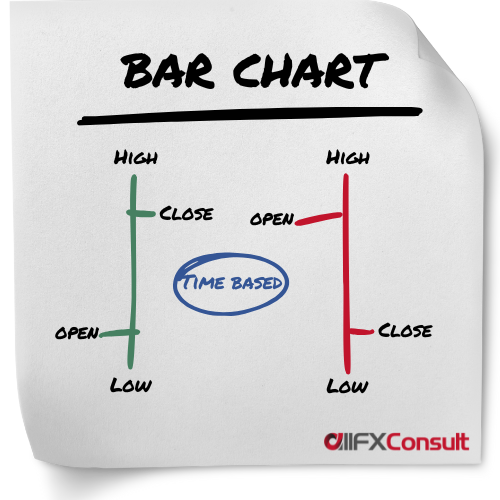
Bar charts were the most widely used charts before candlesticks were invented in the 18th century. They provide a more detailed representation of prices, since they display the closing price like a line chart, together with the opening price, and the highest/lowest price points reached in a session.
Knowing the added details, a trader can have a visual representation of the volatility of the security during a session. The opening price is always on the left, while the closing price is on the right.
Colours green and red, provide a quicker display of bearish or bullish sessions, making them more accurate than simple line charts. The colour of the bar, is chosen after calculating the difference between current closing price and previous closing price of the session rather than the open and close.
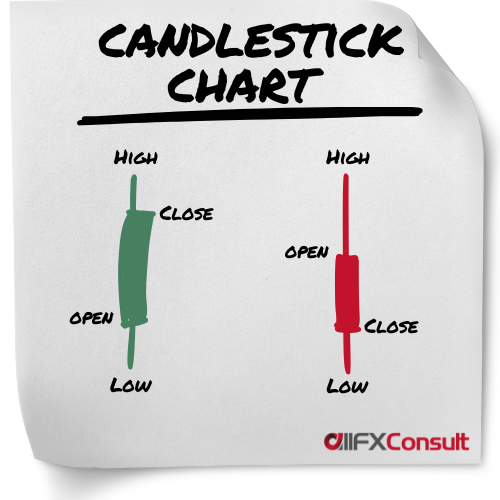
Candlestick charts, are the most commonly used charts in technical analysis. Their origin was traced back to the 18th century in Japan, tracking the price of rice, and they became very popular ever since.
They display the same information as bar charts, but in a different format. Wicks on top and below the bar display the highest/lowest prices of the session.
Colours green (or white) and red (or black) are also showing bearish and bullish sessions, but they take into consideration the opening and closing price of a session, rather than the closing of the previous session. The colours show the “real body” of the candlestick.
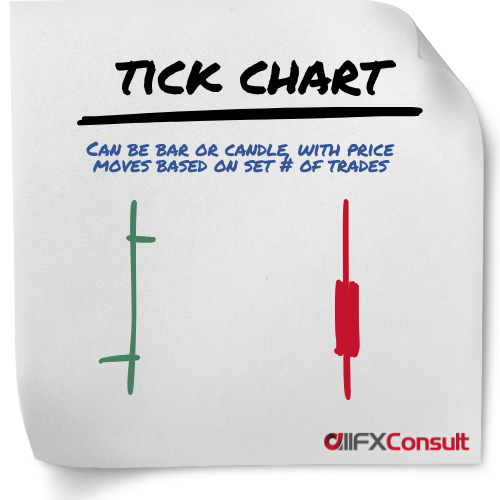
A new bar or candlestick is formed after a specific number of trades (ticks) have occurred, instead of after a time period.
A single bar might form in seconds during high activity or take minutes to form during a slow period.
This approach compresses low-activity periods and expanding high-activity periods, for a dynamic market representation.
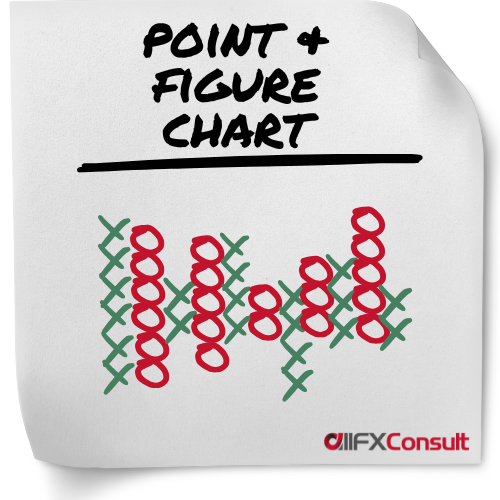
Provide a clear, simplified view of price movements by filtering out noise. These charts use columns of X (for rising prices) and O (for falling prices) to visualize price moves.
Can be subjective, as traders must set a “box size,” the price increment that must be reached to plot a new X or O. A “reversal amount,” typically three boxes must also be set (the price must move in the opposite direction before a new column of Xs or Os is started).
Best suited for position trading aiming to capture broader market moves rather than short-term trading.
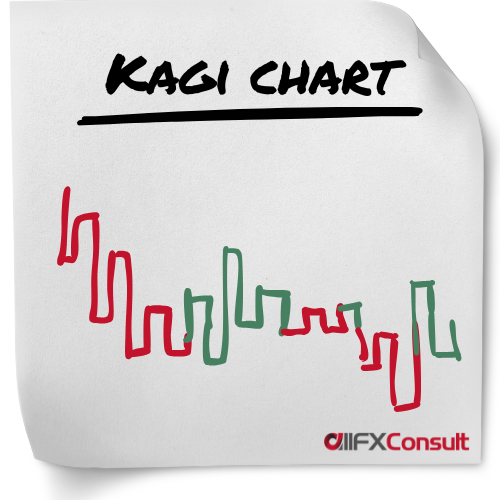
A preset reversal amount is determined (fixed amount, percentage, or based on Average True Range, and only when reached, a new line is plotted on the chart, ignoring time and volume in the process.
A number of vertical lines are connected in a series with short horizontal lines (also called shoulders when a rising vertical line connects to a vertical falling line). The horizontal lines are called waists when a vertical falling line connects to a vertical rising line.
To signal bullish or bearish trends, the lines change thickness or colour. A thick (or green) line is formed when the price increases above a previous high, known as Yang line. A thin (or red) line is formed when the price falls below a previous low, known as Yin line.
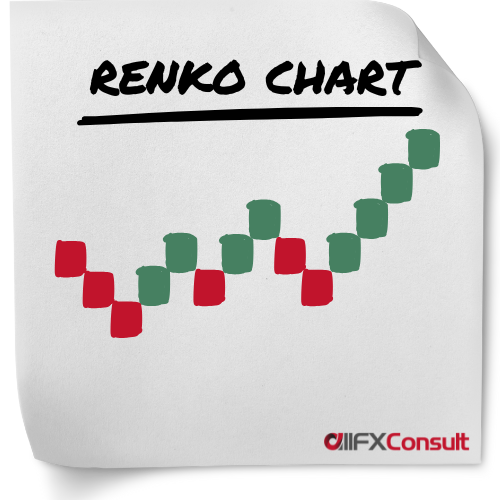
The charts are bult using uniformed sized bricks, as the name “Renko” from the Japanese word renga, means “bricks”.
A “brick size” is specified by the trader (by dollar value, number of pips, or average true range), which is the amount the price must move, before a new brick is added.
The new bricks, are placed at a 45-degree angle (up or down), adjacent and to the right of the previous brick.
When the price moves twice the “brick size”, the chart reverses and starts adding bricks in the opposite direction.
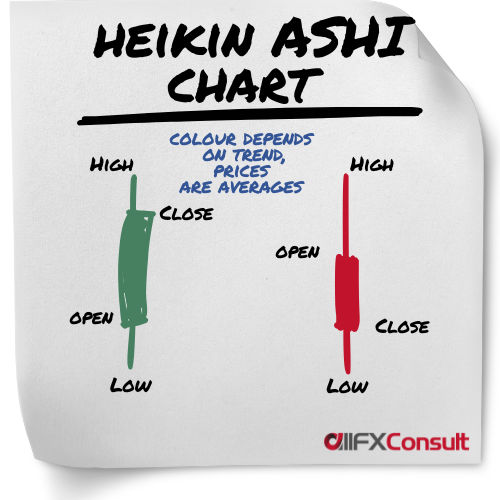
This chart resembles the candlestick chart type, with the difference that it averages all data points to smooth out price action and reduce the noise.
It’s a preferred choice by many professional traders, because it makes it easier to identify trends in comparison to traditional chart systems. Heikin Ashi means average bar, and it is used by traders to see the trend and general direction of the market, to signal reversals in trends, and support any trend strategy that makes sense.

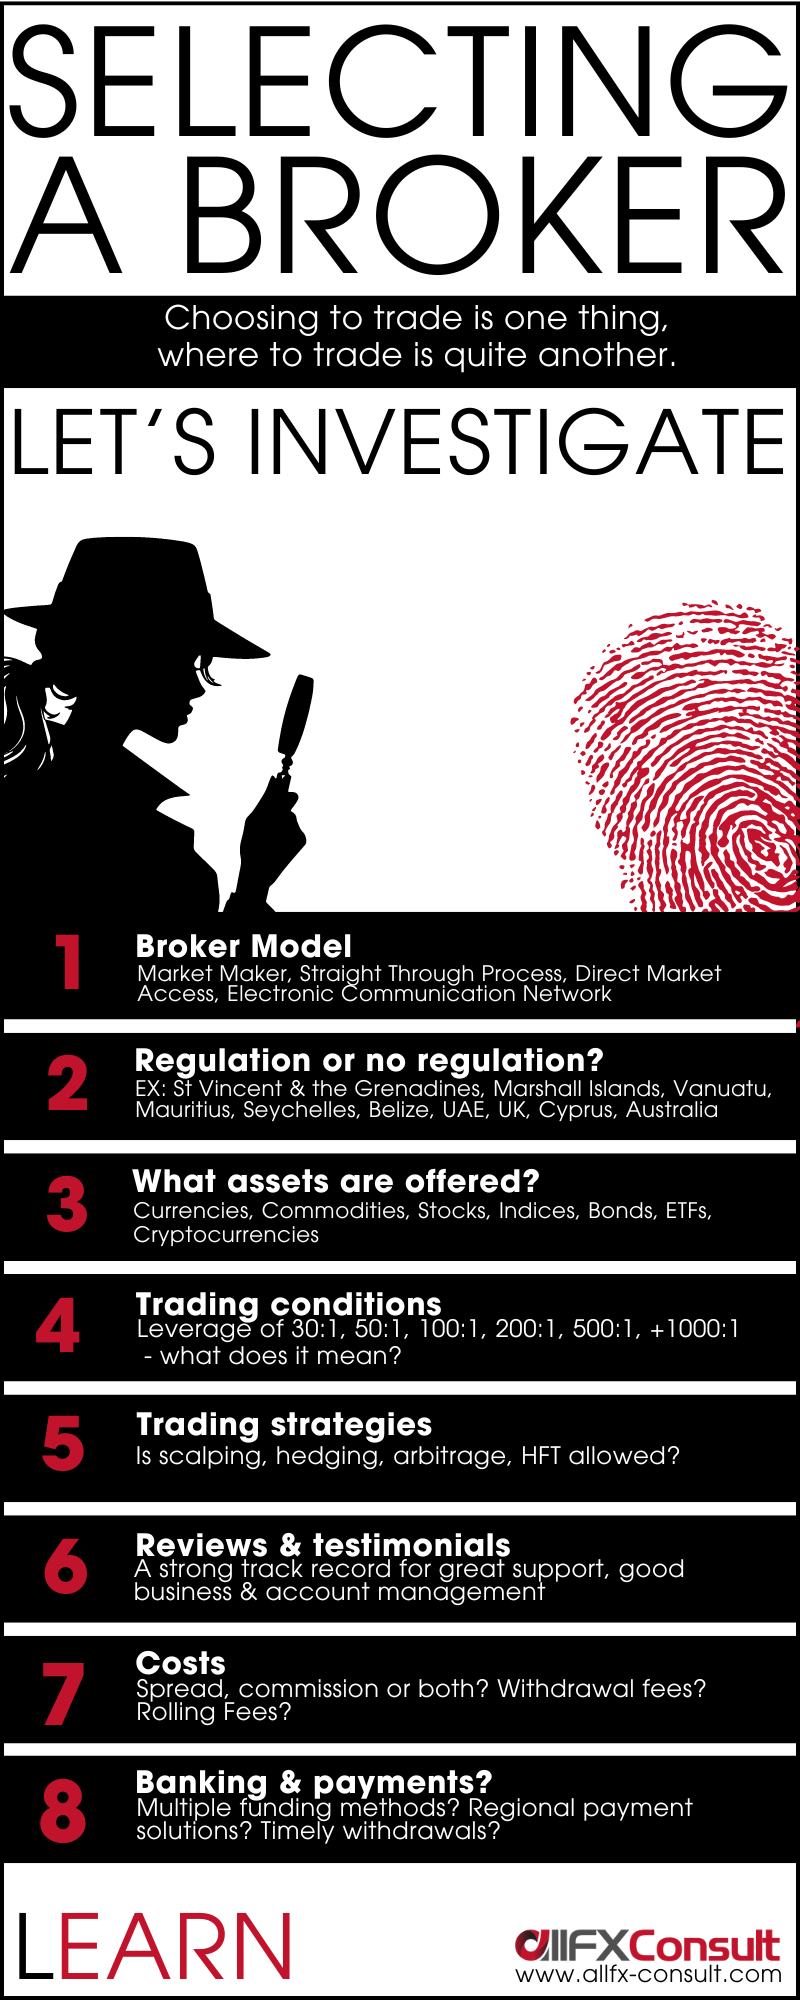
Finding the right broker is not so simple
But when the match is found, the possibilities are endless

Thinking of monetizing your network?
Thoughts, questions, support?
Our team is available 24/7
We can buy technology, we can buy a license, we can buy a building… but performance? Not many service providers can include that in the mix.
We do.
Growth means a lot of things. For us, it starts and ends with performance.
Worldwide workshops on Mindset, Performance, Markets, Industry.
100% interactive sessions, with high energy and real impact.
