
The slippery road of National Debt
If you owe your bank $100, you have a problem. If you owe your bank $1 million, your bank has the problem. It mattered I guess when this quote was popularized by Keynes, but I’m having a hard time wrapping my head around the number 300 trillion, let alone managing it. Global debt is an all-inclusive number though, comprised of sovereign debt, corporate debt and household debt. And since its unmanageable even by the best homo sapiens, we’ll take a closer look at the national debt in today’s discussion and the current situation surrounding it.
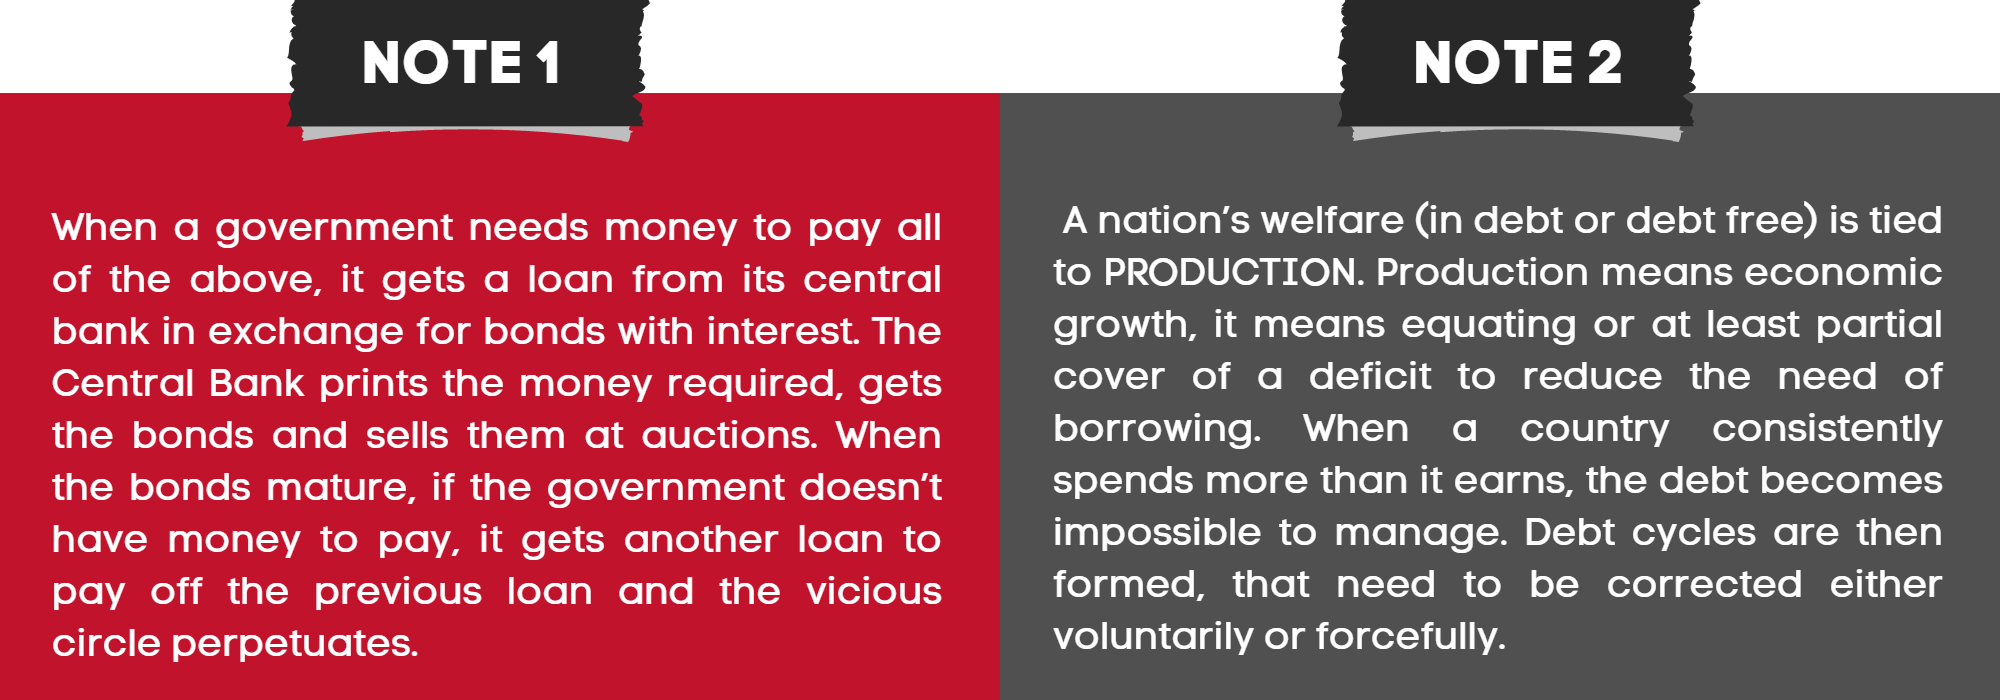
National debt is the total amount of outstanding borrowed sums (pending to be paid), accumulated over a nation’s history. Nations make money from tax revenue and they spend them for social welfare, infrastructure and to promote growth. When they spend more than they make, they accumulate deficits which are paid by borrowing. Borrowing comes in the form of bonds, which is a security issued with a maturity date, that pays back the loan plus an interest. The collective accumulated amount borrowed plus the promised interest constitutes the national debt.
Where does borrowing come from?
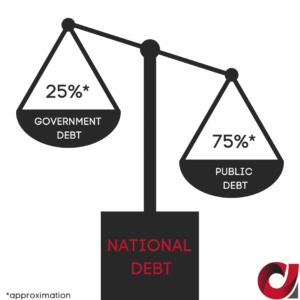
Borrowing can come from anywhere. It’s split into debt held by the public and debt held by the government (intragovernmental). The debt held by the public is held by state/local governments, pension funds, mutual funds, corporations, individuals and foreign nominal/legal persons. The debt held by the government is the amount of debt that the government owes to itself. It is held mostly by government trust funds like social security trusts and insurance trusts. In approximate proportion of 75% for public debt and 25% for government debt, both form the overall national debt. Denmark and the US have a debt ceiling in place.
Debt ceiling? A debt limit that – by law – cannot be passed. If the country reaches this limit, it can no longer get money via borrowing, it can no longer use debt to pay for obligations, fund social programs and services. And like in all things financial, there’s an irony to this as well. Denmark never reached its debt ceiling – almost did with the 2007 crisis – but they increased the limit so high, they can never possibly reach it again. The US reached theirs – 78 times to be exact since 1960 – and increased it, reached it and increased it again and again, you see where I’m going with this. The current US debt ceiling is at $31.4 trillion. The current US national debt is at $30.93 trillion. What’s next?
Debt to GDP ratio
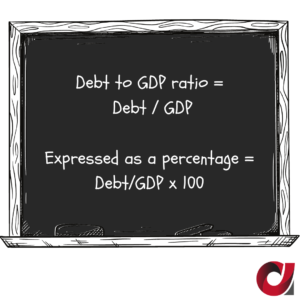
Largely related to the 2007 financial crisis as well as the COVID 19 pandemic, the debt was accumulated to avoid defaults (bankruptcies), protect lives and retain unemployment at manageable levels. According to the IMF, global debt rose to $226 trillion in 2020. Compared to the global GDP, you get a 256% global debt to GDP ratio.
Can these numbers be reduced? How fast and how? More borrowing to pay past borrowing? And if not, what are we to make of this masterpiece?
What do these numbers mean in a context that we can understand?
The World Bank conducted a study in July 2010 called “Finding the Tipping Point-When Sovereign Debt Turns Bad”, that placed lines not to be crossed by countries. If crossing the line is only for short term periods like small recessions, it shouldn’t have much of an effect on productivity. If crossed and extended for longer periods like decades, economic growth is likely to be hindered. Based on its samples of advanced and developing countries, between 64%-77% debt to GDP was found to be a proper estimate.
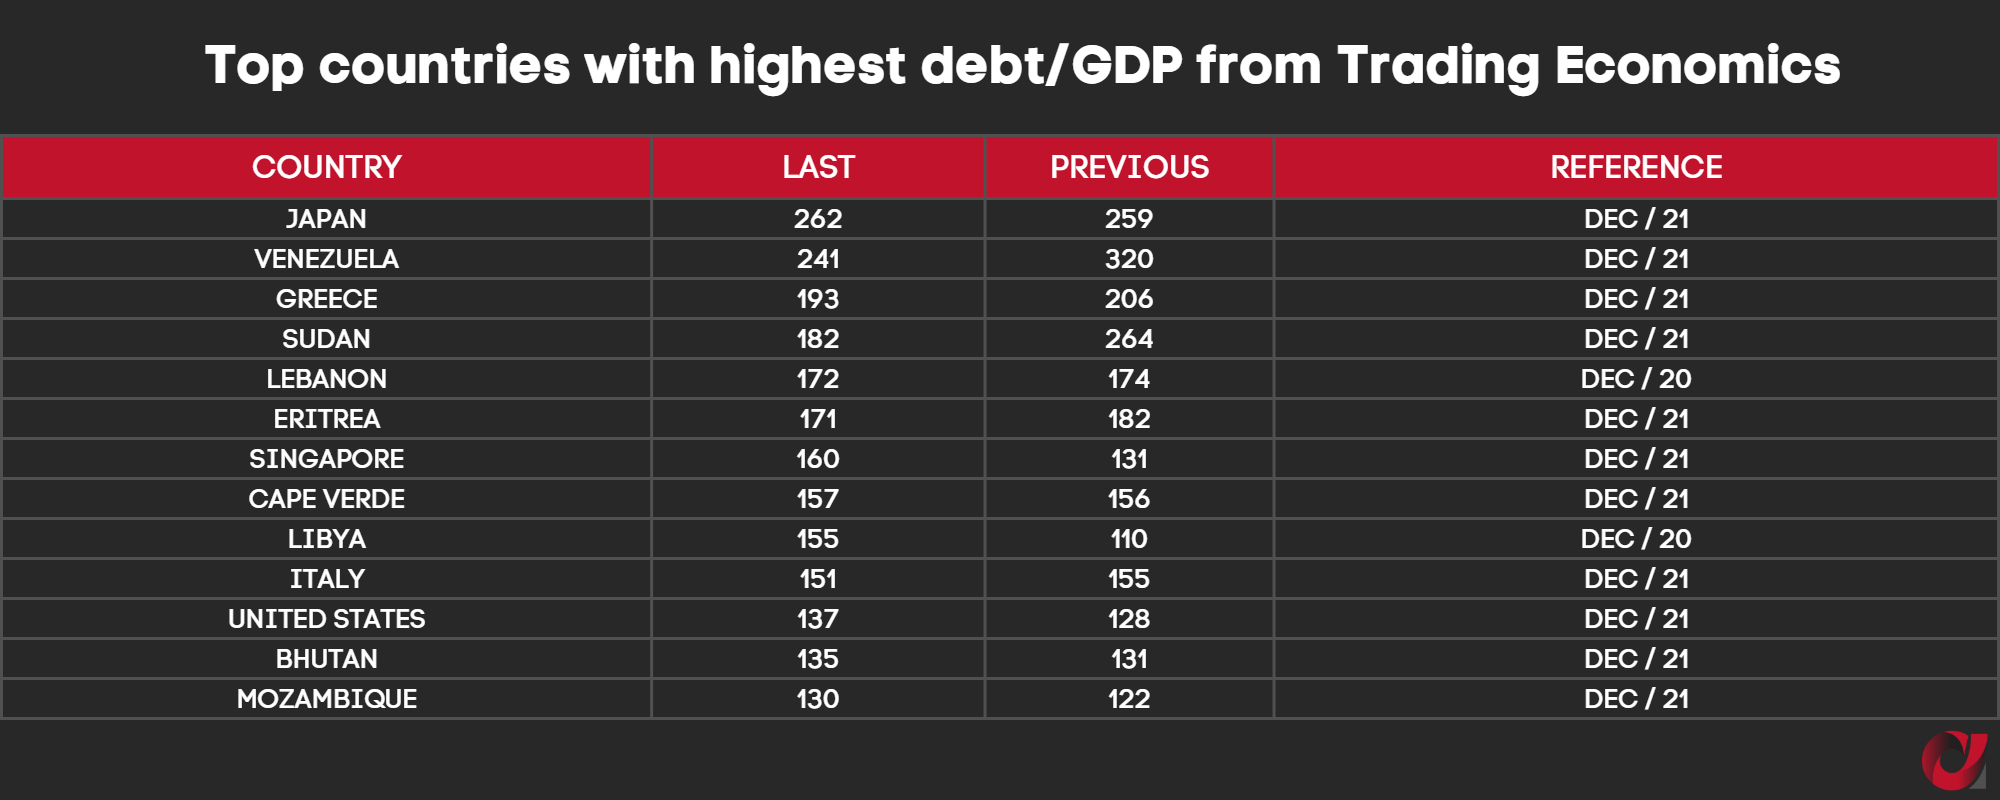
Talking of hindered economic growth is one thing. Entering the realm of country defaults is a different story. Another study conducted by Hirschmann Capital, with information taken since the 1800s, showed that 51 out of 52 countries that passed the 130% debt to GDP ratio, defaulted one way or another.
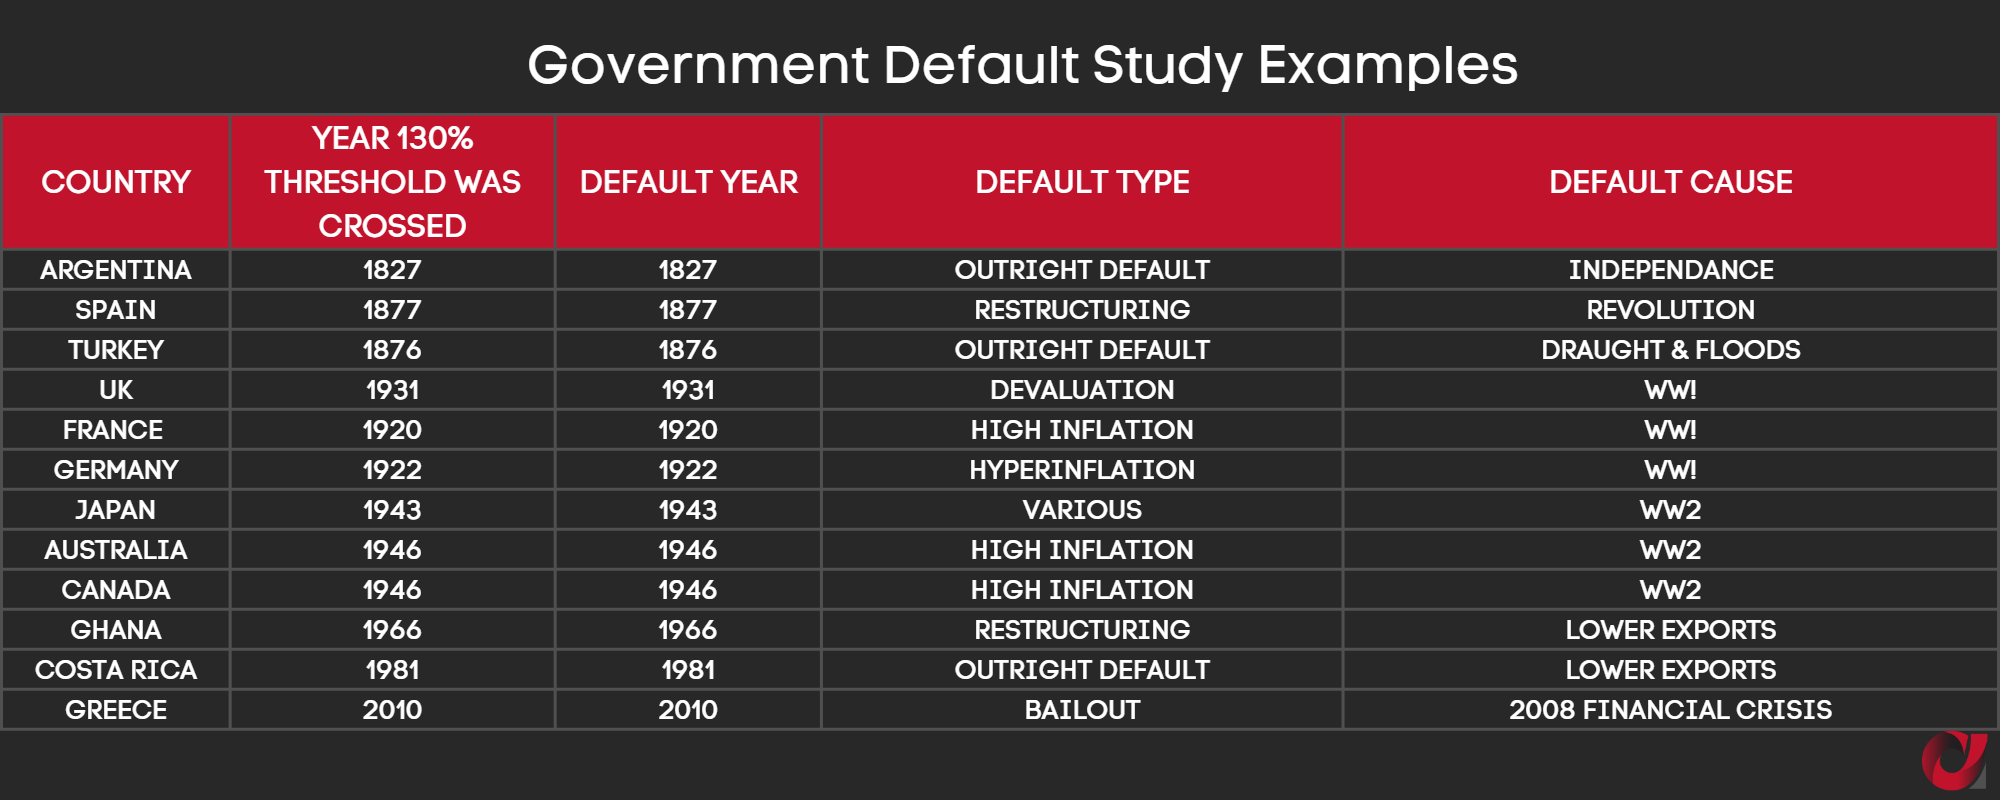
Table contents from Hirschmann Capital (Source: Reinhart & Rogoff, RIETI Japan, Bloomberg, HC Estimates)
So if countries today crossed the line by a longshot, why don’t we see them defaulting already?
To put things in perspective, a country will choose to default when the gains of not paying its debt exceed the cost of default. That is if the country has a choice. Here is a broad classification of defaults:
- Disorderly default – “Violent”, with no time to prepare both for the banking sector or the citizens who are unable to react. Described by the collapse of all financial transactions, bankruptcy of banks and a steep increase in unemployment. Cyprus almost went through this back in 2013, if not for a bail-out program from the Eurogroup, the EU and the IMF of €10 billion, in exchange for impossible obligations (like tapping in people’s bank deposits).
- Orderly default – Happens for the same reasons as the disorderly default, but this is a strategic choice of the country filing for it. There is a consensus reached between the lender and the borrower, with milder consequences to the economy and its people. It allows for a quicker comeback to the international markets. There is time to set things right unlike the disorderly default, and unemployment is much less severe.
- Selective default – Partial default of payments and loans. Selecting to default on one or more obligations, but continue to pay some. In general, its characteristics are similar to the orderly bankruptcy.
Greece is an example of a country that defaulted as a result of the 2007 financial crisis, while other European countries facing similar numbers didn’t. Partial reasoning? the ability of a country to pay its debts relative to its ability to raise surpluses. Belgium and Italy as an example, were also hit by the crisis and had high debt ratios but were able to raise surpluses while Greece wasn’t. Another indication that economic output/production is imperative. A country consistently spending more than it earns, is on a downhill spiral. Passed the point of no return, odds are that a restructuring, devaluation, higher inflation or outright default is inevitable.
In the early 2000’s (which was also the beginning of the housing bubble), emerging markets were urged to take on credit from advanced countries to finance their operations. With very low interest rates to provide cheap money and attract borrowers, emerging markets jumped on the train to what they thought was the answer to their problems.
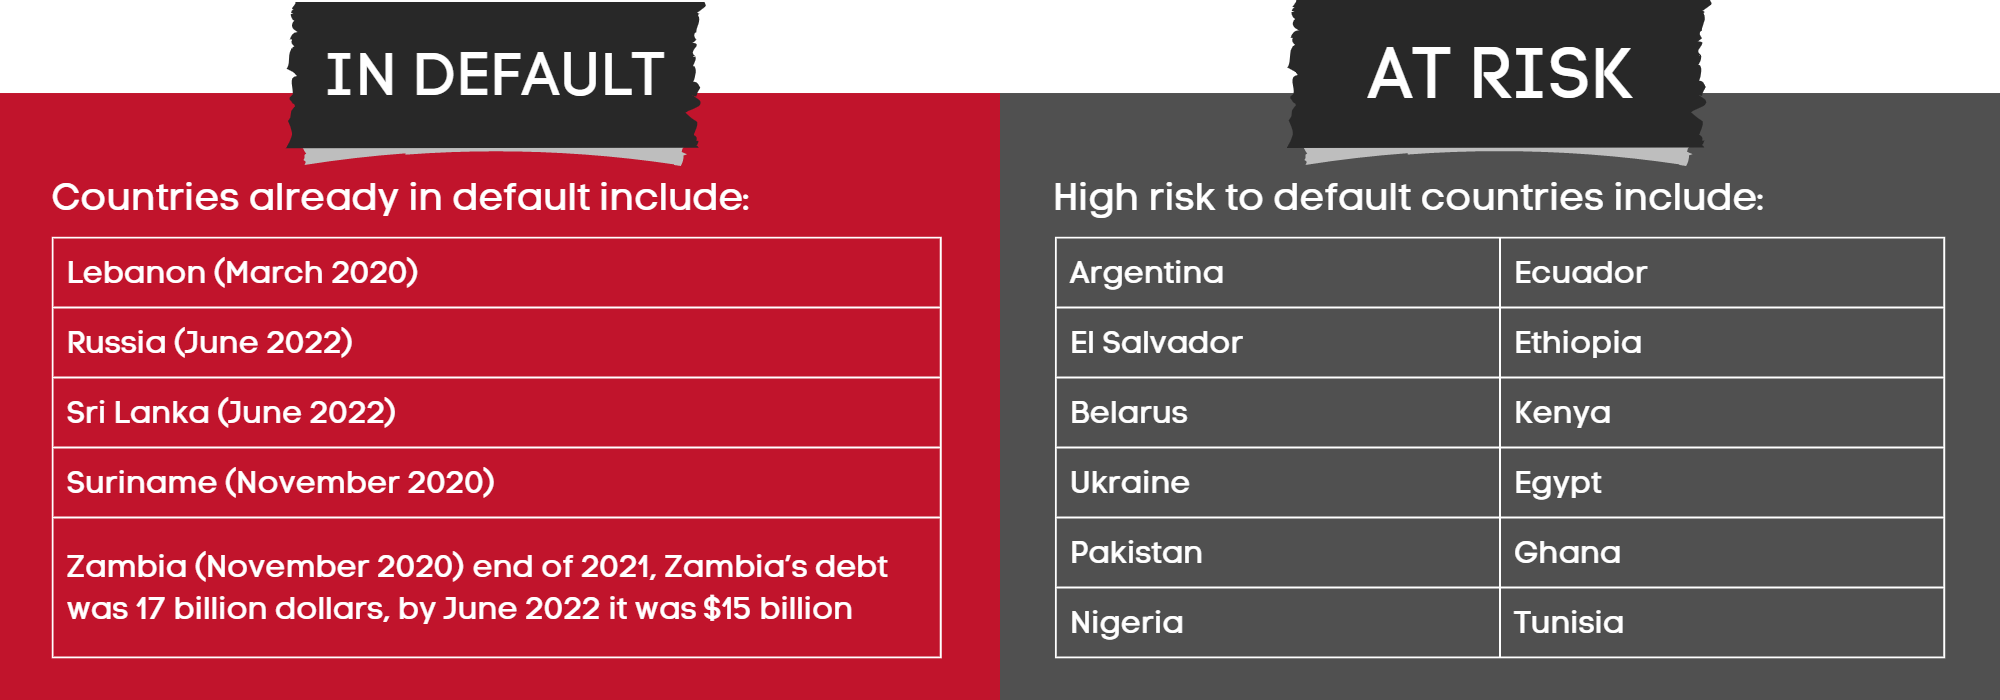
Taking Zambia as an example, the country is largely dependent on copper mining and rain-fed agricultural production. Zambia ranks 6th in the world in terms of Copper production (2nd in Africa after the Democratic Republic of Congo) and depends on weather to support its agriculture. Its external debt was so large relative to its output that it became unsustainable, and it became the first African country that defaulted on its payments during the pandemic.
Chinese creditors hold 1/3 of Zambia’s debt (or approximately $6 billion). The creditors include Industrial and Commercial Bank of China, Jiangxi Bank and China Minsheng Bank. Some say Zambia is a test case, with the world eyeballing how China handles debt restructuring as well as the precedent this case sets, for other countries in risk of default to follow.
IMF among others, point out the following “remedies”, relative to lowering debt:
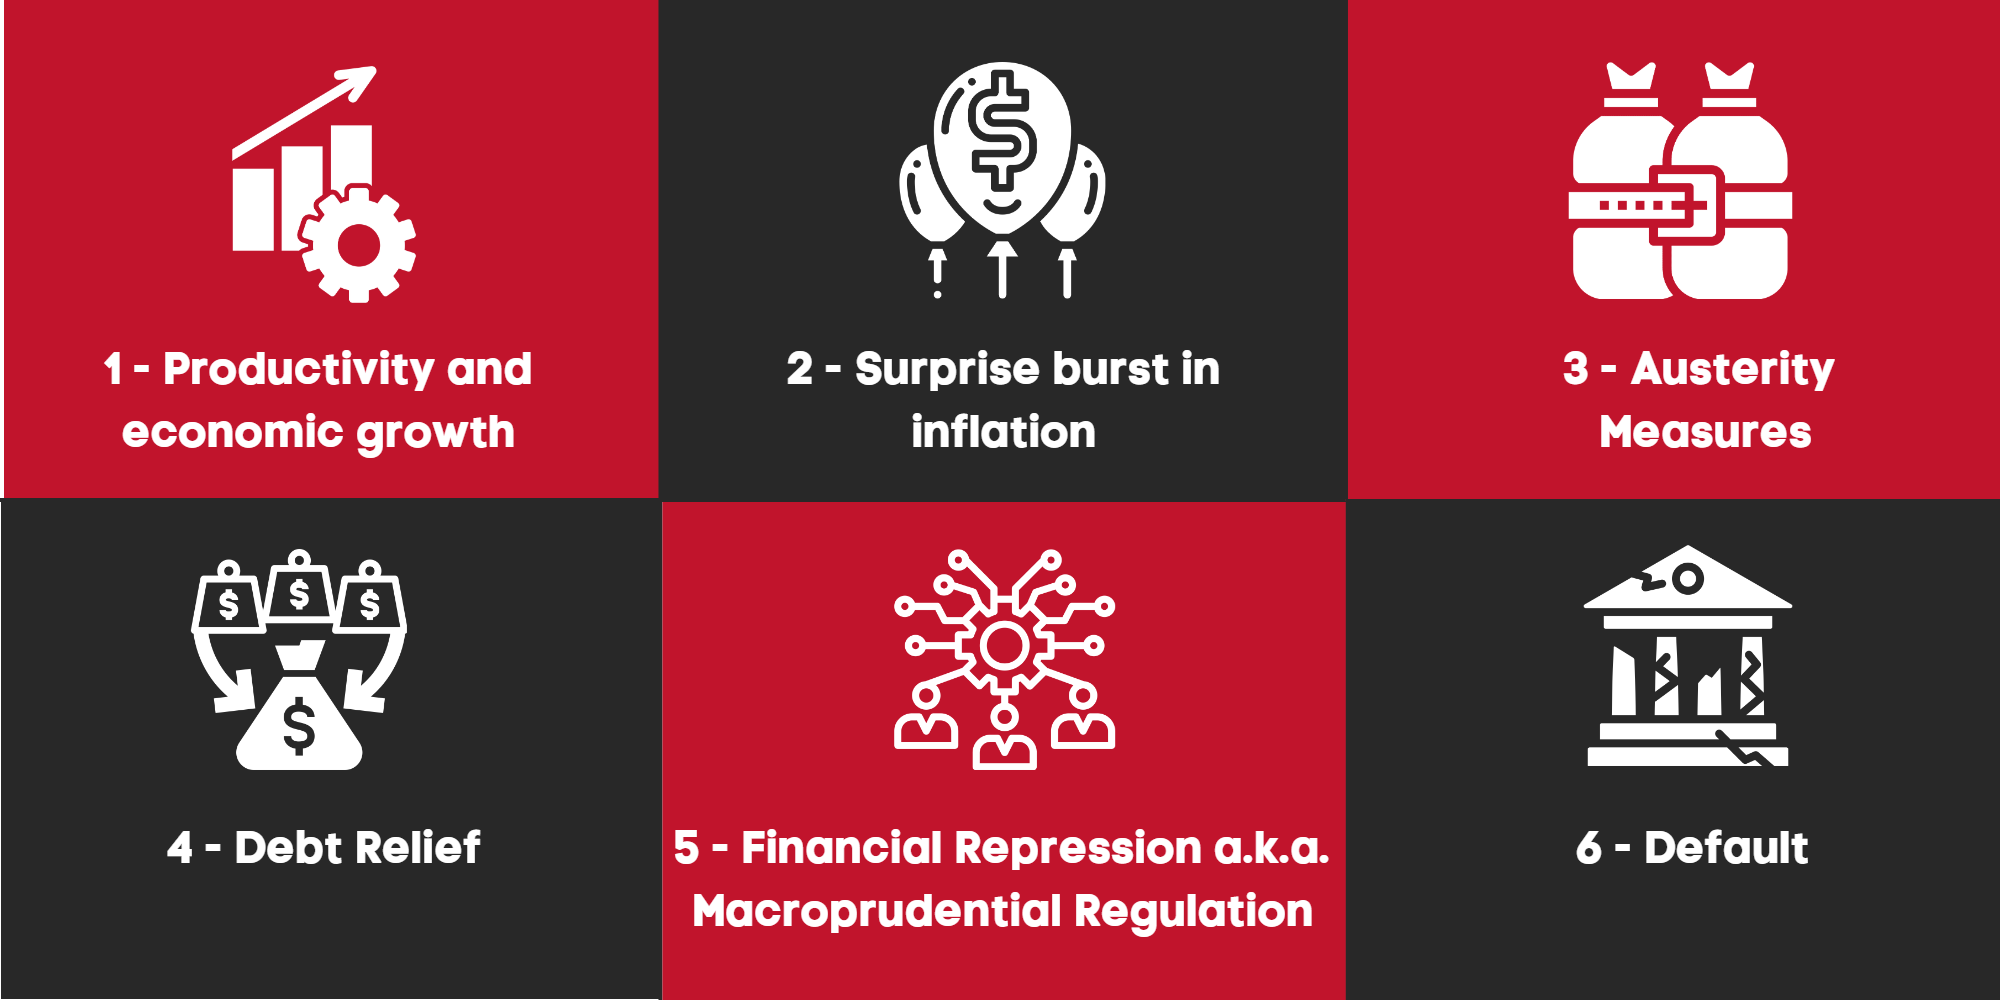
- Productivity and economic growth – produce more than you spend or better yet, spend so that you can produce.
- Surprise burst in inflation – which reduces the nominal value of the debt and increases tax revenue due to higher prices.
- Austerity measures – Cut spending, increase taxes, accept any tomatoes thrown your way
- Debt relief – Debt restructure and gold revaluation maybe?*
- Financial Repression a.k.a. macroprudential regulation – government policies that redirect funds intended to go somewhere else, to the government. Helped countries reduce debt after the end of WW2 and is coming back due to the large amounts of current debt. It includes tighter connection between banks and government, pension funds/domestic banks lending the government, regulation of cross border capital moves, higher reserve requirements, prohibition of gold purchases (Gold Reserve Act of 1933).
- Default
*Is gold revaluation an option?
The term “gold revaluation” over the years fell victim to speculations and conspiracy theories. The outcome is a biased approach (depending on who benefits from such action and who loses). Not to be confused with the gold revaluation account held by central banks (where they can realize profits from the rise of gold price relative to the cost of buying it). Although related because, if you use gold revaluation to register unrealized gains and write off debt in your balance sheet, you’re in the foothills of a gold standard system. And if that’s the case and you check the relationship between money in circulation relative to the gold held in reserves (which is what the gold standard is suppose to do), you will find that the backing percentage is very low.
The gold revaluation we’re referring to, is mostly Rothbardian (see Murray Rothbard’s gold revaluation ideas) who popularized the possibility. Imagine returning to a gold standard system and fixing (pegging) the gold price per ounce, based on the quantity of gold central banks have in reserves relative to circulating money. Similar to 1933 in the US, when the government confiscated gold at the current price ($20.67 per ounce) and then immediately revaluated it to $35 per ounce (gold Reserve Act). Should the same concept happen today, from $1,800 it could reach anywhere between $10,000 to $50,000/ounce. Why? As explained by Jim Rickards, author of “The New Case for Gold” if the global gold reserves are 34,564 tons (as far as we know, since central banks don’t disclose the full numbers), to reach a peg of 20-40% of M1, you would need to price gold astronomically high. 40%? M1?
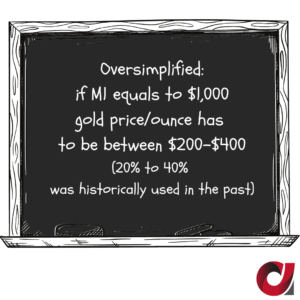 M1 is a measure of money supply (measuring from M0-M3). M1 is also known as narrow money, all the currencies and assets that can be easily converted into cash. The further you go on the M scale, the broader the money it measures and the less liquid (easily convertible to cash) the assets are. Rickards explained that 20-40% of M1 is historically a workable percentage used, when money was pegged to gold in the past (see image). The law in the US from early 1900s to 1950s said that gold price multiplied by the amount of gold in reserves had to amount to 40% of total money supply (Federal Reserve Act of 1913). Due to the Vietnam war and the need for money, they had to curtail the law, but 40% worked just fine. He also said that the Bank of England in the 1800s managed a successful gold standard when Britain became dominant power after the fall of Napoleon and until WW1 with 20% gold backing the money supply.
At $1,850/ounce, gold reserves relative to money supply is extremely low. If we consider M1 in the US hypothetically at $10T (with 8,000 tons of gold reserves), the gold is backing approx. only 4.75% of M1. The value of gold to back 40% of M1 would need to be approx. $15,600. If you take Rothbard’s approach of 100% backing, the value of gold should be approx. $39,000/ounce. What?
Here’s how it works out*:
M1 (hypothetically is 10 Trillion) / Tons (8,000) = $1,250,000,000 (Price per ton)
$1,250,000,000 (Price per ton) / 32,000 (Ounces per ton) = ~$39,000 (Price per ounce)
$39,000 (Price per ounce) x 40% = ~15,600 (Price per ounce)
At $1,850 (Current price of gold per ounce), backing is 4.75% (39,000 x 4.75%)
*For accurate calculations you will need to replace the hypothetical numbers with current ones. The above is meant to explain gold revaluation, and does not reflect our opinion on whether it is a viable strategy or not.
According to the World Gold Council
Worldwide Total Gold Reserves by Region = 31,422.57 tonnes = 34,564.827 US tons
- America = 8,133.46 (North America) + 614.68 (South America) = 8,748.14
- Europe = 11,776.29 (Western Europe) + 3,433.59 (Central & Eastern Europe) = 15,209.88
- Asia = 3,332.62 (East Asia) + 878.72 (South Asia) + 809.30 (Central Asia) + 731.28 (South-East Asia) = 5,751.92
- Middle East, North Africa, Sub-Saharan Africa = 1,460.46 (Middle East & North Africa) + 172.28 (Sub-Saharan Africa) = 1,632.74
- Oceania = 79.89
 Last but not least, there is a reason credit/debt is not taught the way it should to youngsters in schools. Keeping the majority financially illiterate is the way to maintain and distribute wealth how the minority sees fit. You can be the person that gets a loan to buy a house to live in and have constant cash outflows, or the person that gets a loan to buy a house, then rents it to someone else and has cash inflows.
In one of Kiyosaki’s appearances, he mentioned that during the financial crisis the banks gave him tax free money (credit), somewhere around $300 million to buy property because they knew he would turn them into cash inflows. So where everyone was defaulting on their payments and losing their homes, he was finding dirt cheap properties that are now worth whatever they are worth, producing cash flow and making him even more rich. That’s $300 million out of $700 billion injected into Wall Street through the TARP program. Story for another day but think of how much wealth was produced from the left over $699.7 billion.
Debt/credit may not be as bad a your grandparents said it is. As long as you put it to good use.
The information provided is strictly for informational use and is not meant in any way to be construed as investment advice. One should seek expert advice, as all investment strategies involve risk of loss.
Start your Brokerage business by:
Connecting offshore: With our clients in Belize, Seychelles, the Caymans, Martial Islands and St. Vincent offering the most flexible IB and White Label solutions.
Connecting in the EU: With our clients in 15 out of the 28 member states offering strong partnerships to individuals and corporations with existing client base, looking to connect.
Contact us for a private conversation to discuss your case through the contact form or one of our emails at info@allfx–consult.com, partners@allfx-consult.com.
#startaforexbrokerage #ib #forex ib #whitelabel #forexwhitelabel #tied agent #regional partner #forexlicense #forexoffshorelicense
You might find this interesting
Capital Markets Training – for corporations and individuals
Forex White Label – Discover it all, requirements and options
EU Tied Agent – Should you consider it or not?
Forex jurisdictions – EU and Offshore with country stats and listed brokers