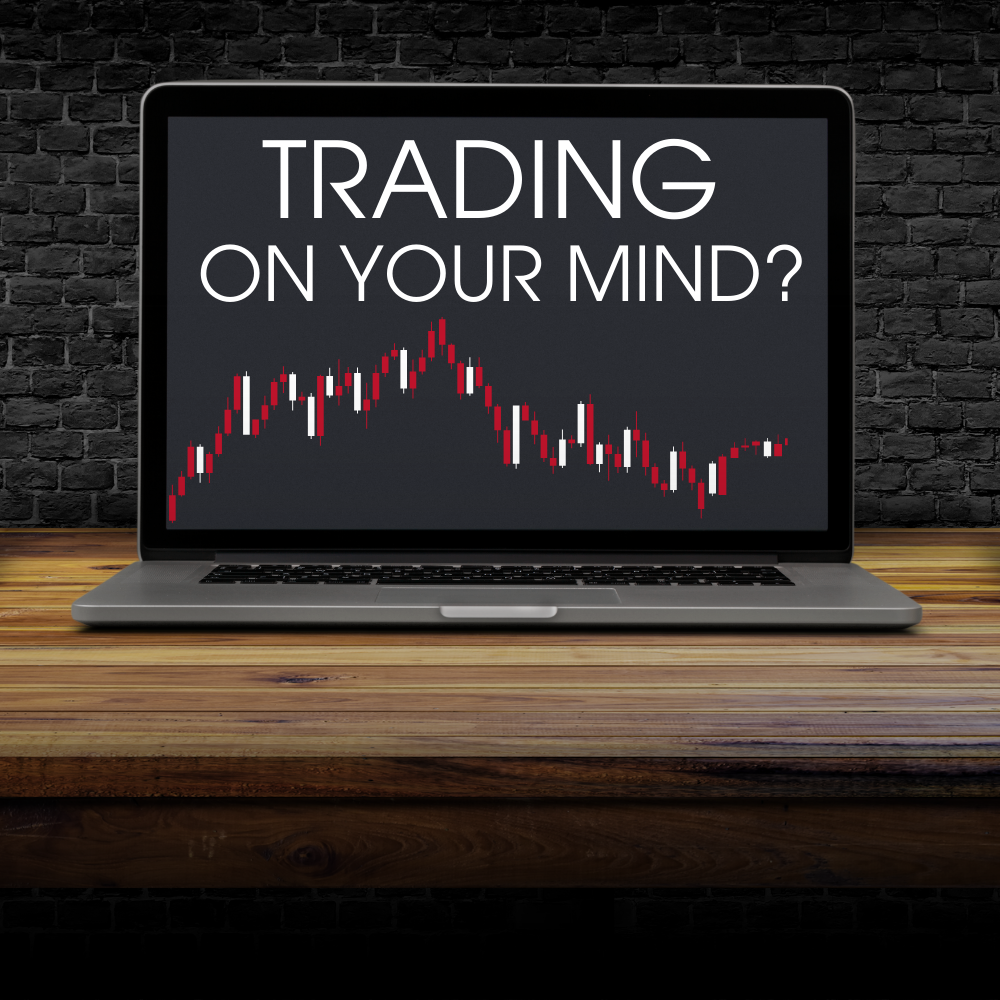
Trading on your mind?
LEARN the basics and beyond
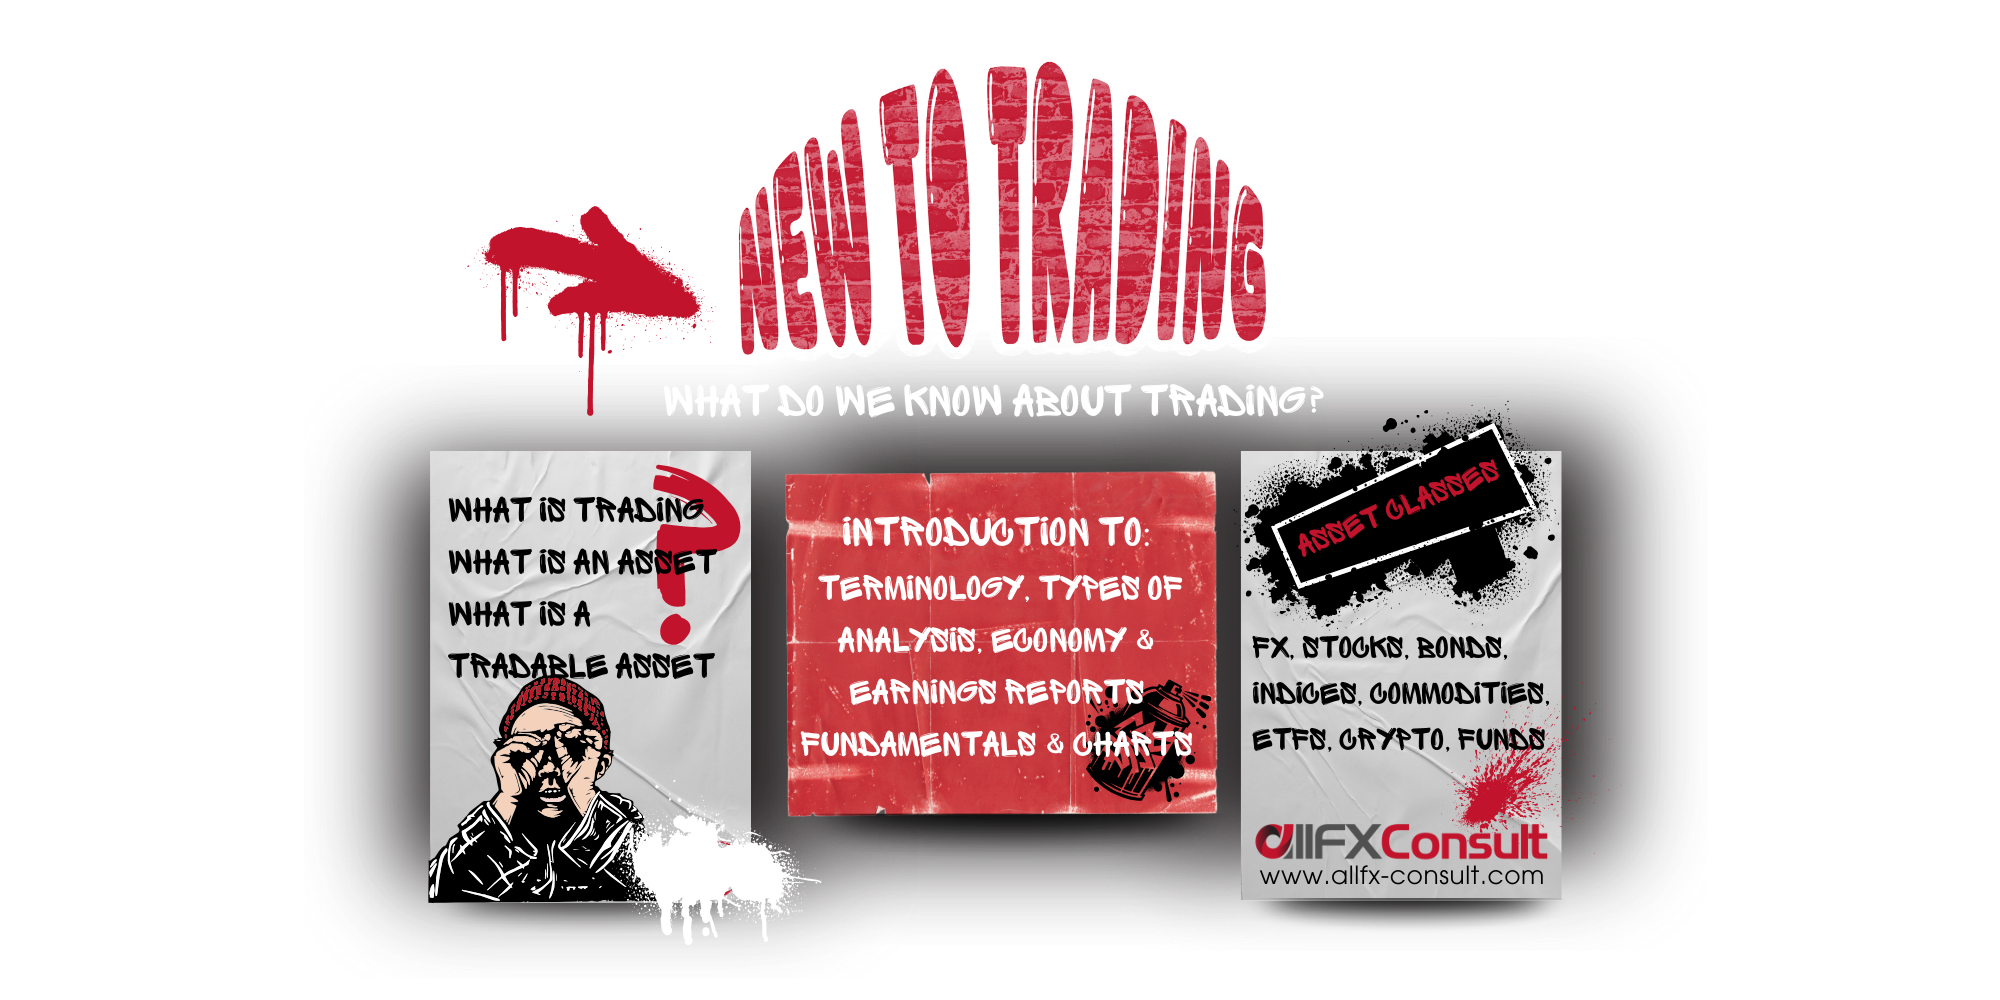
What do we know about trading?
The adventure is unbeatable
the rush, the framework, the constant movement
The emotions are extreme
the excitement, the panic, the fear and the greed
The outcomes are not certain
the wins, the losses, the fight for a balanced win

Trading in a nutshell
What is trading?
Trading is the intentional side of investing. Instead of buying and holding valuable assets, trading “rides the waves” of the asset’s rising and falling prices
What is an asset?
Anything valuable owned by an individual, a company or other entity, and has the potential to generate further economic value. Think real estate, inventory, cash, machinery, financial instruments
A tradeable asset?
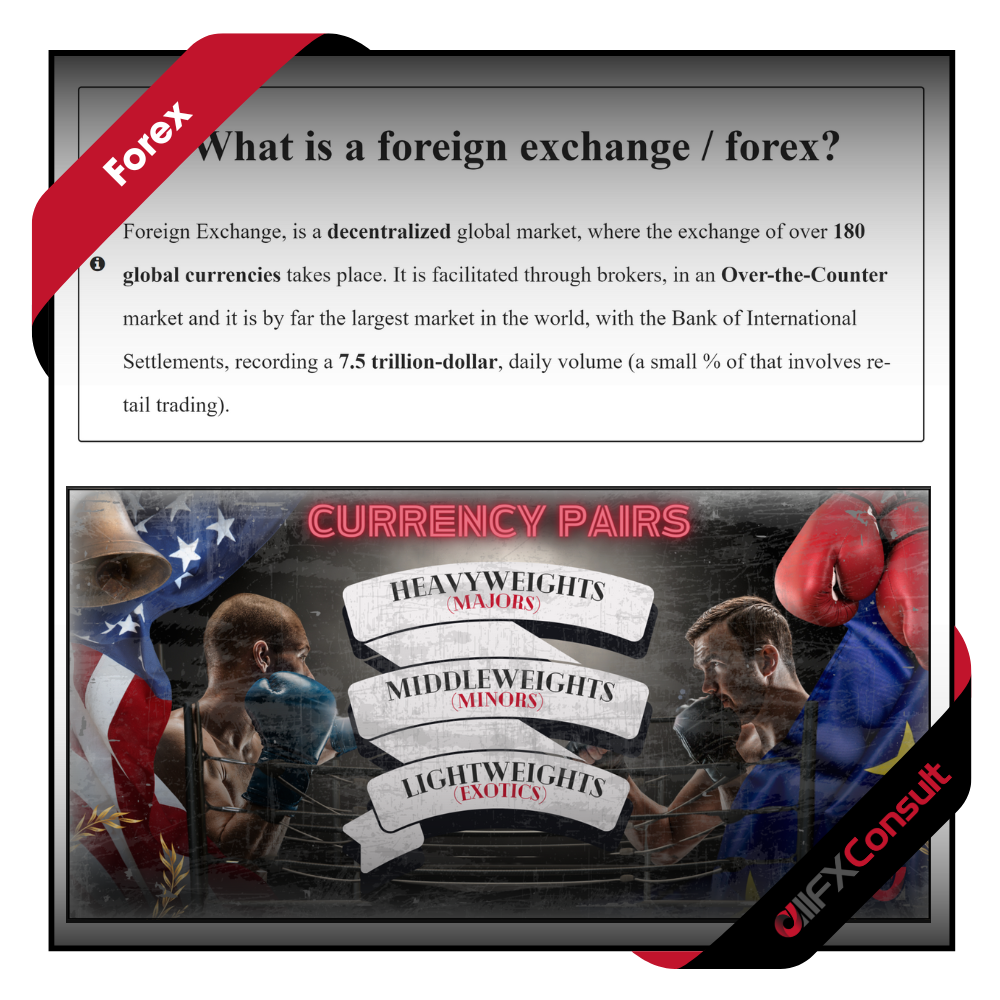
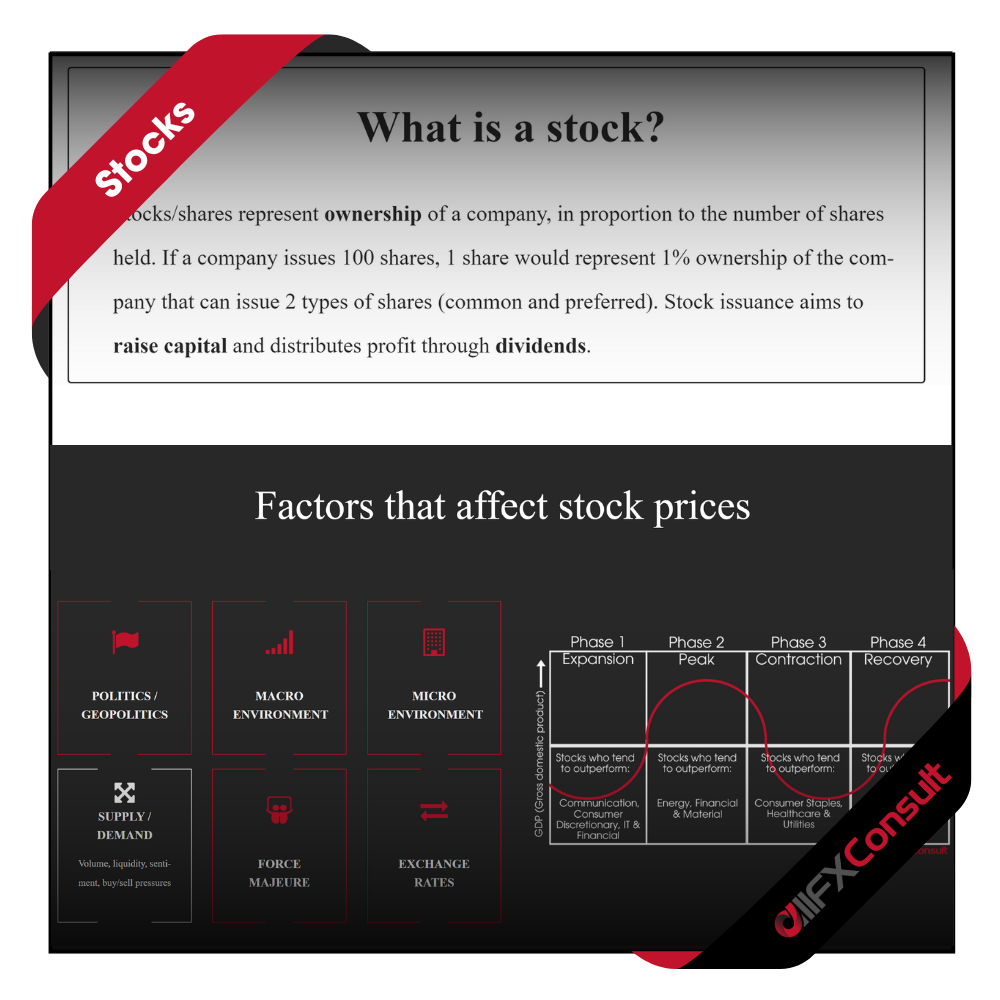
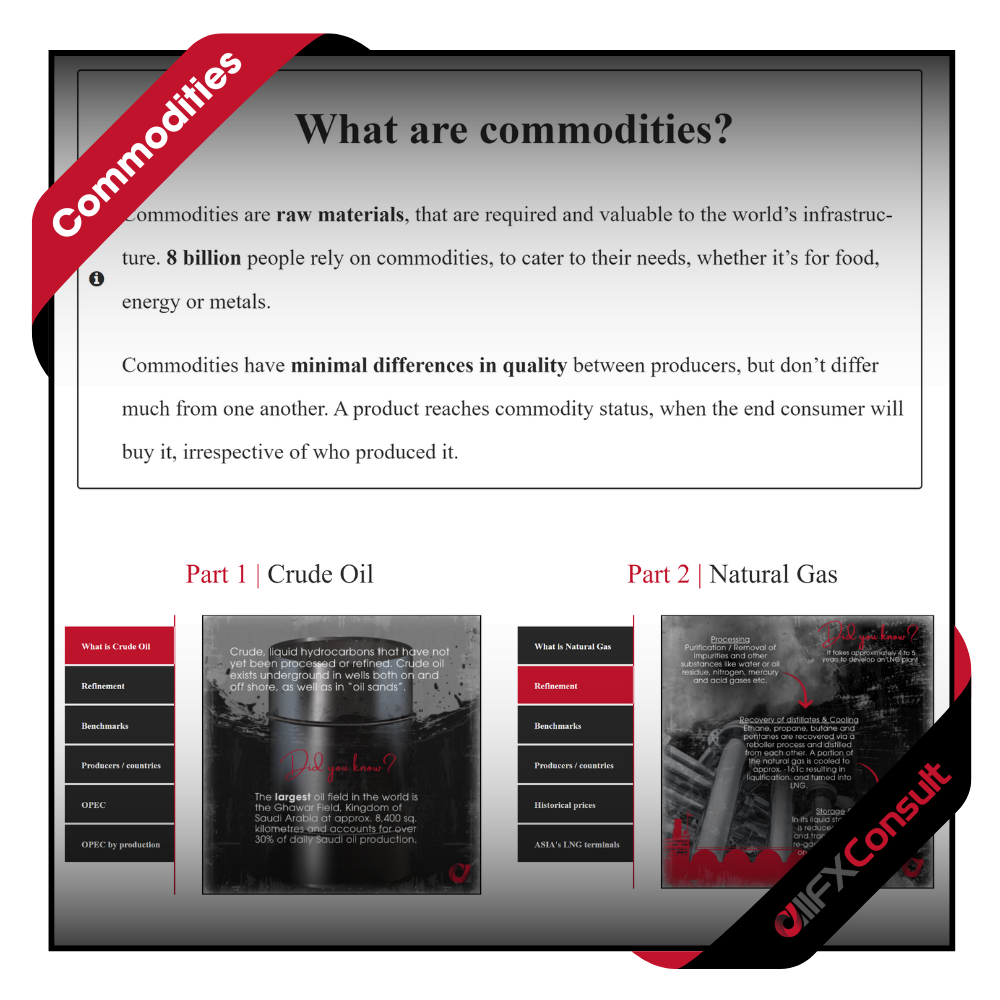
Anything with economic value that can be bought, sold, or exchanged with the goal of profit. Grouped into categories called asset classes, they share similar characteristics, behaviour, and legal governance
Forex, Stocks, Bonds, Commodities, Indices, ETFs, Crypto, Funds
a collection of resources for anyone

Now that we know our asset classes
let’s look at trading terminology
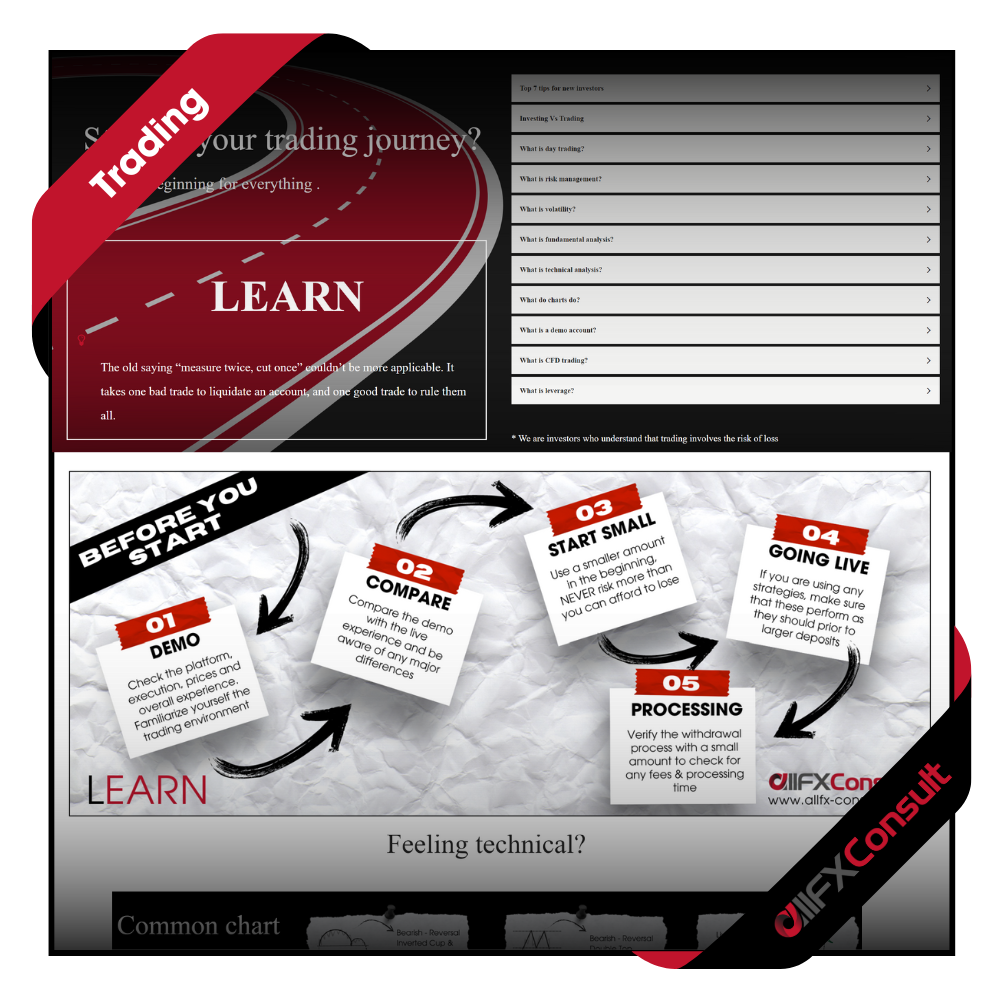
Starting your trading journey?
There’s a beginning for everything .
* We must all be investors who understand that trading involves the risk of loss

Remember
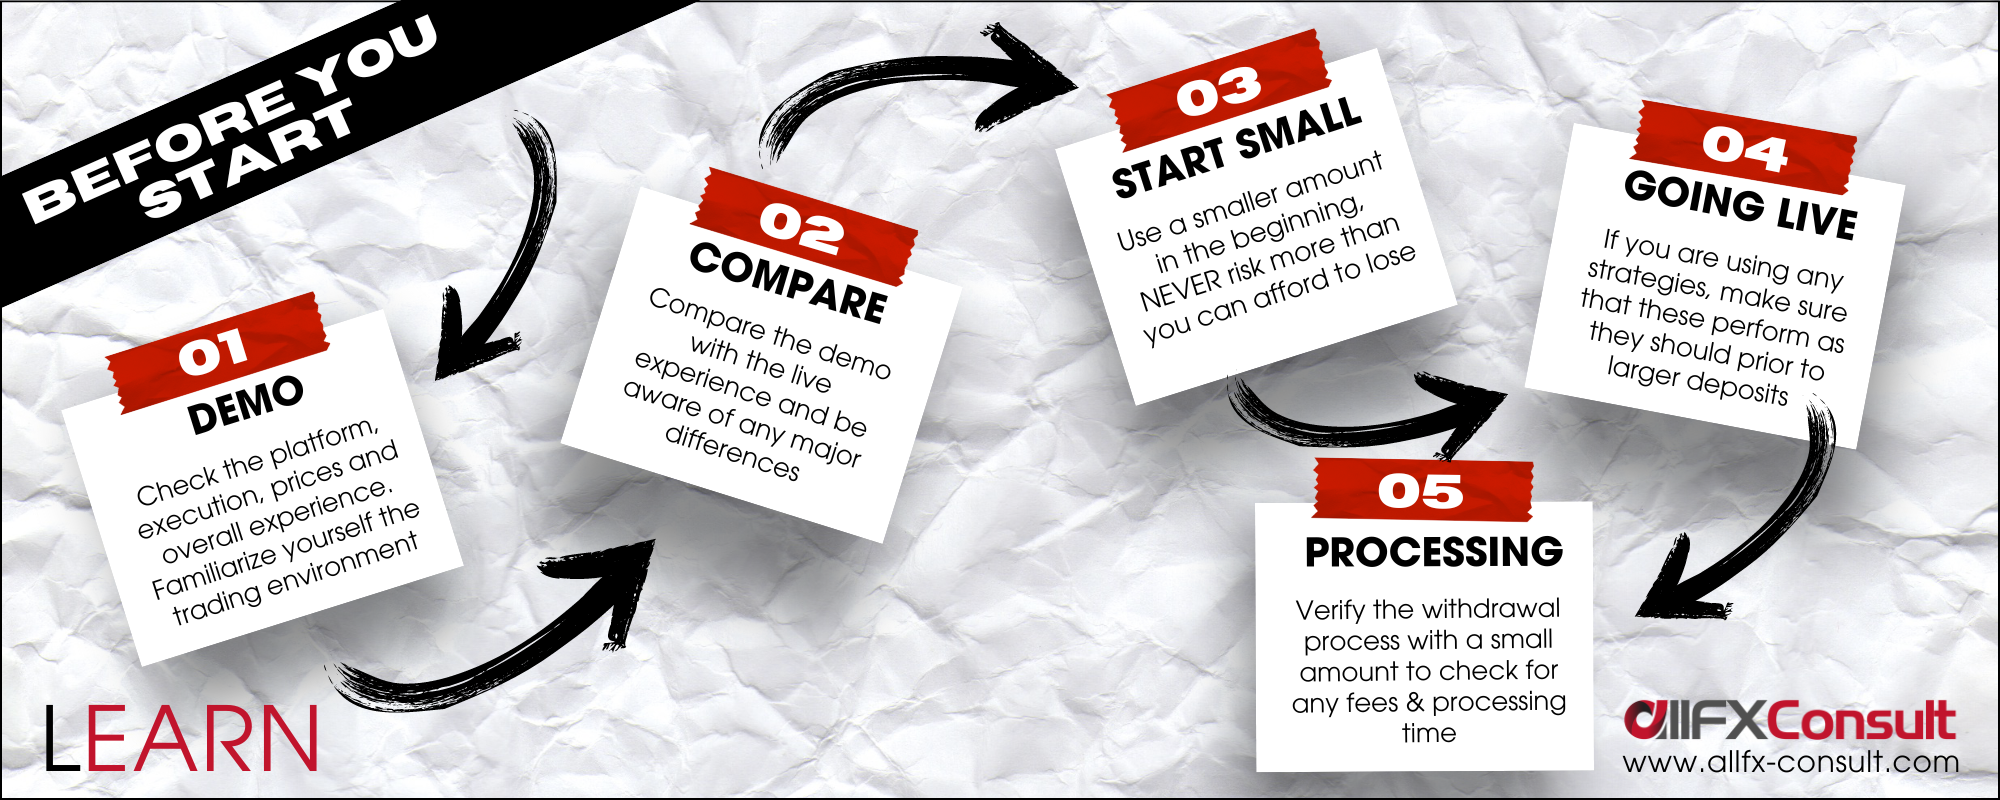
Already on the road?
Map your direction
* We must all be investors who understand that trading involves the risk of loss
There are thousands of groups that trade the same way you do. Become part of their environment, exchange ideas and experiences, learn from one another. Find a mentor that has no conflict of interest with your account, and harness their experience.
Not all markets need to be traded. Focus on what’s right for you and your account. Diversification doesn’t mean to trade all instruments. Have your sights on what’s important at the given time and keep things simple.
Technology evolves. Trading evolves. Markets evolve and change behavior depending on the economic conditions. Constant learning and improving, is the difference between a flat account and an active one.
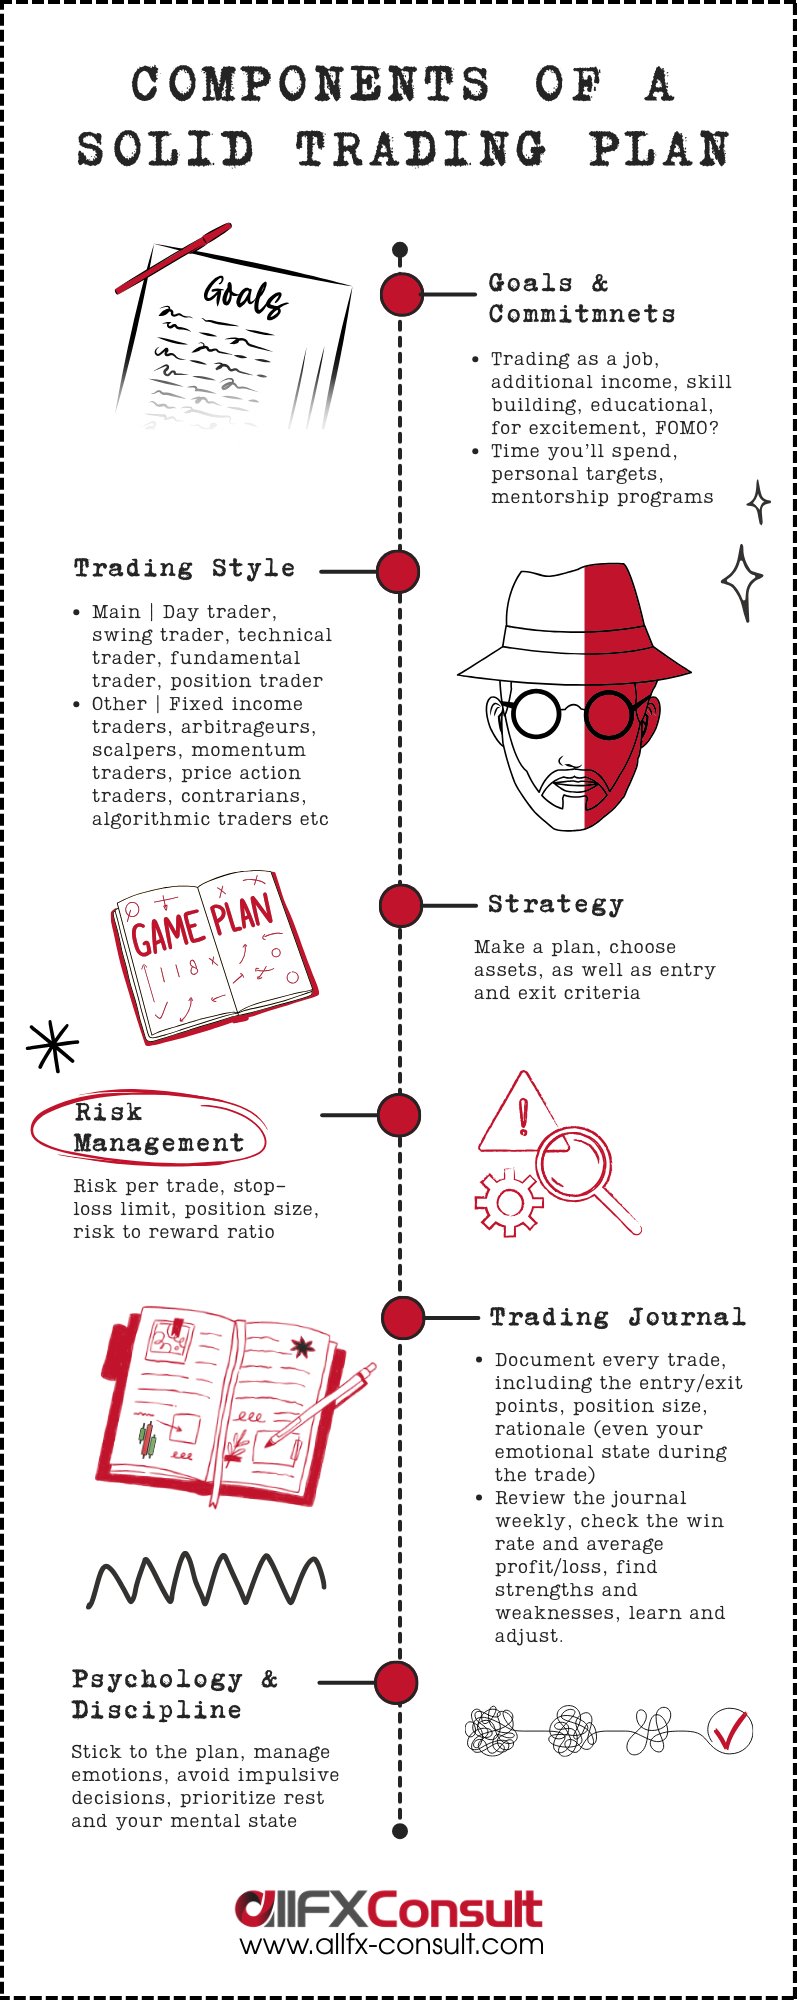
Trading essentials
that secure a good start
A broader understanding
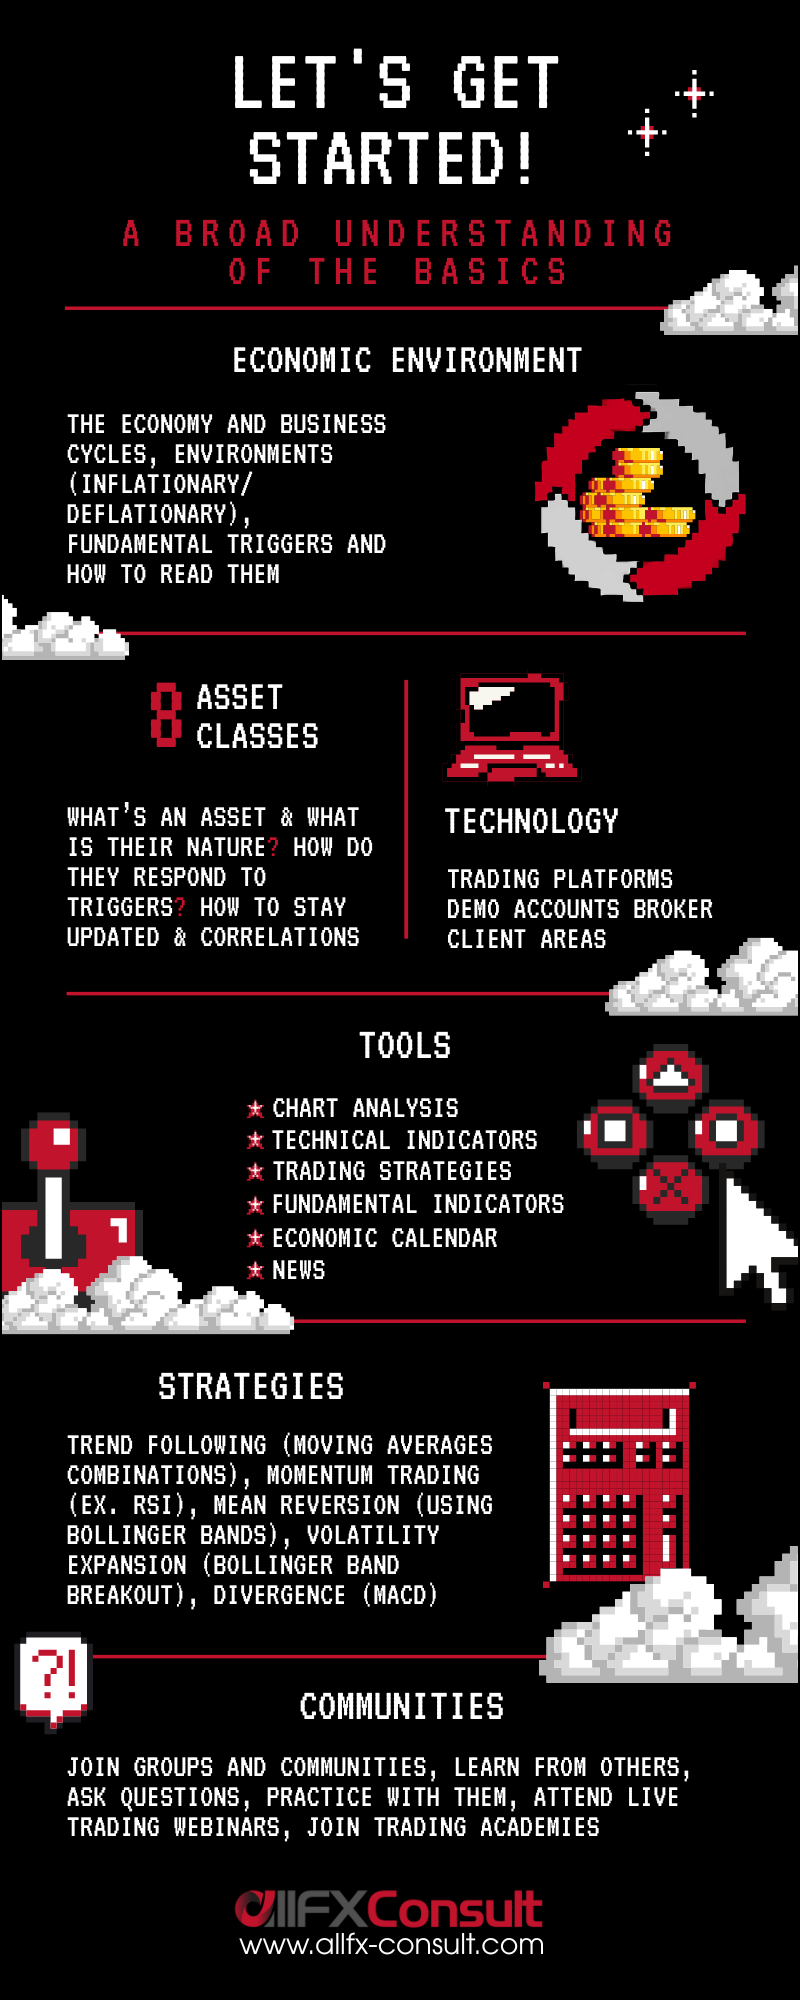
A broker with a platform
A solid trading plan
What is risk in trading
the possibility of losing some or all of the invested capital
Demo account
Practice before going live
Risk per trade
1-2% of capital
Risk on all open trades
5% of capital
Risk to reward
1:2 or 1:3
Daily/weekly loss limits
If reached, stop trading
Stop-Loss
Automatic close (at loss)
Take-Profit
Automatic close (at profit)
Leverage
Higher risk/reward
Impulse, avoid
Overtrading, revenge trading
Stay current
News, alerts, reports
Hedging
Offset positions
Diversification
One loses, another gains
Market risk
Markets can be affected by a variety of exogenous reasons, causing sudden moves and spikes. Uncertainty triggers volatility, and the result might not allow a strategy to perform as expected.
Liquidity
The trades are affected by the volume of transactions at any given time. Not enough liquidity, increases commissions, increases volatility due to sudden spikes, and slows the environment.
Leverage
Speculated trading has leverage in its core. Many traders favour higher leverage, since it allows bigger position sizes with smaller margins. The higher the leverage, the higher the risk (or reward).
L&D
Trading the markets is comprised by multiple elements. Since no one can predict with 100% accuracy what will happen next, the least we learn and develop, the worse our chances to do well.
Operational
Trades are executed over an online trading platform, that sits with a broker. Platforms themselves might encounter issues, there could be internet connectivity problems, or human error.
Impulse
10+ stages of emotions have been recorded to understand trading psychology. Fear and greed are the biggest culprits of impulsive decisions and they are very difficult to control lowering results.
Regular stop-loss
Predetermined limit to automatically close a position at the expected loss.
Problem: Doesn’t guarantee the close, exactly the set limit (because of slippage).
Slippage: When markets move faster than a requested price, the market gap fills the trade at the next available option (can be positive or negative).
Guaranteed stop-loss
Same as the normal stop-loss, but limit is guaranteed. Slippage doesn’t matter when stop-loss is guaranteed by the broker.
Problem: Broker might charge a fee for the tool.
Trailing stop-loss
Predetermined distance from the current price. Moves together with the price.
Problem: No problem here. The stop-loss can result in a profit if the market moves in the direction of the trade.
How do traders analyze the markets?
Technical and Fundamental analysis
Technical analysis
Technical analysis is the way traders study markets, to predict future price movements using past price data and patterns, by focusing on charts, price trends, and technical indicators.
This method is useful for all asset classes (stocks, forex, cryptocurrencies, and commodities). Beginners can start by learning basic charts, then move to indicators, patterns, and more advanced strategies.
It’s important to note that, technical analysis considers that all element are already factored in the current price, that trends are your friends and that history tends to repeat itself.
Technical analysis does not guarantee profits. It is a tool that increases probabilities. Combining it with risk management and trading discipline, it becomes a powerful tool.
Tools used:
-
Charts: Candlestick, line, bar, heikin ashi
-
Indicators: Trend, Volatility, Momentum, Volume
-
Support and resistance: Identify concentration zones (supply/demand)
-
Patterns: Double tops, head & shoulders, triangles for reversals or breakouts
Fundamental Analysis
Fundamental analysis is the way traders analyze factors other than price action, to examine an asset’s “real value”, to help them predict their influence on future price moves.
Instead of looking at charts and historical prices, fundamental analysts look at external events (politics, geopolitics, economic indicators, industry trends, as well as the financial statements of companies.
Top-down fundamental analysis: Taking the bigger picture first, a broader view of the economy before narrowing it down to a specific company.
Bottom-up fundamental analysis: Taking a company’s news and financial statements, and broadening out to exogenous factors that could affect the price.
Tools used:
-
Financial statements: Balance sheet, income statement, cash flow, top/bottom line
-
Valuation metrics: Revenue, Price-to-Earnings, Debt-to-Equity, Free Cash Flow
-
Macroeconomic data: Interest rates, inflation, GDP, retail sales, PMI
-
Governance: Ownership, leadership, ESG, innovation, risk management
Technical analysis
Historical data are used to forecast future price moves. All market information, is already reflected in the price
Uses mainly past market data, on price and volume
Mostly forecasts short to medium-term outlooks
Technical tools like charts, technical indicators and patterns
Mostly used by day traders or swing traders
Fundamental analysis
External (politics, geopolitics, economy) as well as internal (financial statements) factors analyze an asset’s real value
Uses mainly economic calendar and company statements
Mostly forecasts medium to long-term outlooks
Metrics (P/E, D/E), earnings reports and economic data
Mostly used by position traders and growth investors
Here’s how it all looks like
charts, calendar, market watch
Wondering how to read the calendar, and what all these indicators mean? Visit our large database of fundamental indicators
 MARKETS PULSE
- Stocks Sink in Broad AI Rout Sparked by China's DeepSeekU.S. stocks were mostly lower, with the Nasdaq leading declines as makers of AI infrastructure suffered steep falls, many in the double digits. Nvidia was down 16%.
- Comex Gold, Silver Settle LowerGold settled 1.4% lower, down two of the past three sessions, and silver fell 2.5%, down three of the past four sessions.
- DeepSeek Won't Sink U.S. AI TitansPanic fueling the selloff of Nvidia, Broadcom and other tech giants is overblown.
- Financial Services Roundup: Market TalkGain insight on Experian, SoFi Technologies and more in the latest Market Talks covering Financial Services.
- Arabica Coffee Prices Hit Record on U.S., Colombia Tariff SpatArabica coffee prices hit a record level, as traders digested the withdrawal of President Trump’s threats to impose tariffs and economic sanctions on Colombia.
- Swiss franc, Japanese yen Rise as DeepSeek News Boosts Safe HavensThe Yen and Swiss Franc were stronger against the dollar as investors sought safe havens after Chinese start-up DeepSeek’s new AI model hit U.S. tech stocks.
- Natural Gas Falls on Shifting Weather ForecastsU.S. natural gas futures fell after weekend updates took some of the chill out of early February weather forecasts.
- Building-Products Distributor QXO Launches Hostile Bid for BeaconQXO is taking its offer directly to shareholders after being rebuffed on several occasions.
- Natural-Gas Firm Diversified Energy Strikes Deal for Permian Basin PlayerMaverick Natural Resources has operations in Texas and Oklahoma.
- What's New This Tax Season That Can Save You MoneyThere are some new wrinkles, especially for those who sell things online or bought an EV.
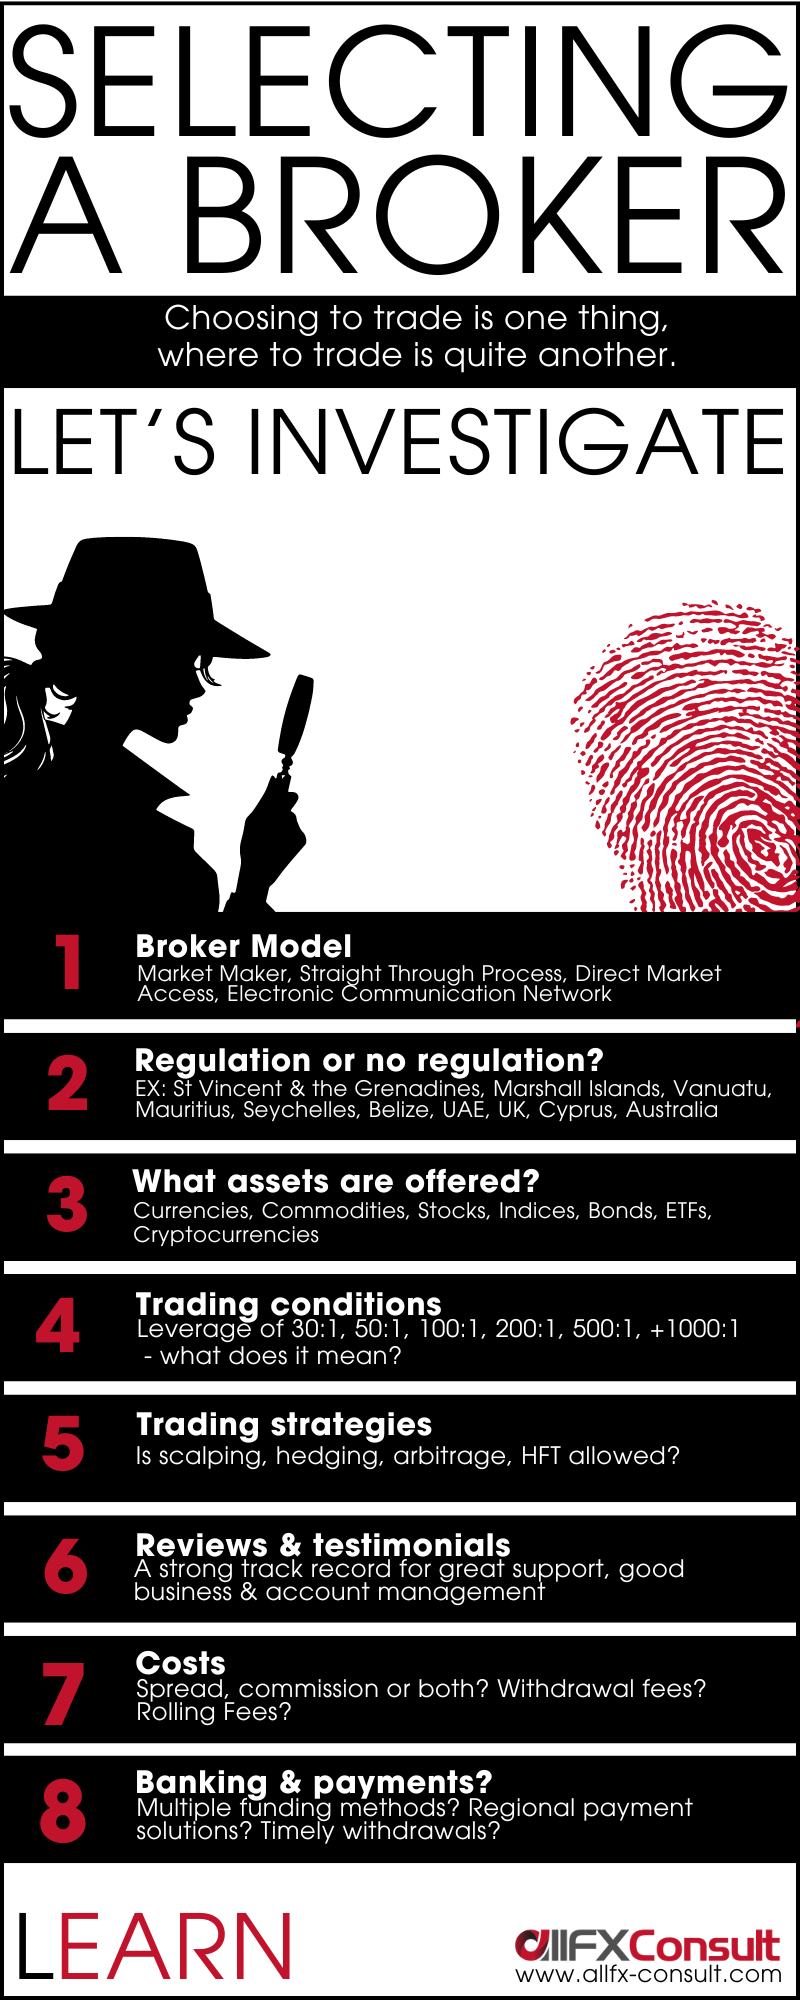
Finding the right broker is not so simple
But when the match is found, the possibilities are endless

Thinking of monetizing your network?
Questions, thoughts, support?
Our team is available 24/7