Debt – Could modern monetary theorists (MMT) be our ladder out of the pit? We’ll look into it, but not before we take you through the traditional schools of thought
“Debt is the slavery of the free” said Publilius Syrus. Depending on whom you ask i suppose. Modern monetary theorists believe we can print our way through any obligation as long as certain conditions are met. We’ll get there eventually but not before we go through older schools of thought and how economics evolved through the years.
Great debates (that are not searching for a winner but the truth), make people, well… better people. In our search for arguments to support an idea, we end up revealing so much about ourselves and others. A real search also paints a more pragmatic picture of what’s happening around us, without restraints and blinkers of orthodox or unorthodox statements. In a nutshell, just because someone says something is true and everyone goes along with it, it doesn’t have to be the one and only correct statement.
A friend asked the other day if economics is a science. And there you have it… we ended up rolling up our sleeves and debating some fascinating subjects that made a nice salad, interesting enough to put in today’s topic.
So what is science?
For a field of study to fit the framework of science, it needs to collect and analyze data, present objective hypothesis and theories that can be tested in controlled environments, and finally come up with agreed and irrefutable true/false results.
Does this apply with economics?
Every economic model was founded on solving a fundamental problem. The problem is that there is a finite (limited) amount of resources for product output, while the demand for human consumption of goods/services is essentially limitless.
By nature the problem has no solution. New economic theories cannot be tested in controlled environments. They would need to be applied in everyday life, but it they go bad, they can go really bad. Imagine the implications of a newly applied economic theory that plays with debt, income and spend, with all of them impacting directly everyone’s daily life.
For this reason, economics have always been regarded as a social science more than anything.
Social science and the evolution of economics.
In the old days, people produced what they needed to produce, then they collectively produced and shared the benefits, then they produced what was needed and desired, all within a framework believed to be a free market. This free market set its own prices and rules of trade, without external intervention.
Then along came hard recessions a.k.a. depressions, and intervention was needed to contain an out-of-control spiral of business cycles (from boom to recession and back to boom again).
The evolution took place in a world where nations didn’t know economics and all they knew was hoarding precious metals i.e. silver/gold, to the creation of schools of thought that studied how the world operated to increase the wealth of nations – which was the foundation of economics – and finally with governments intervening through their policies to smooth out these business cycles.
These schools of thought from Smith’s Classical, to Menger’s Austrian, and Keynes’s Keynesian, played their role in how we approach economics today. There’s a new school of thought, very interesting to look into as well called the Modern Monetary Theorists (MMT). More on MMT below.
The economic schools in a nutshell
Adam Smith’s classical view, studied how nations operated to increase their wealth. This view argues that we can make the world a better place by being extremely selfish. By making the best decision for yourself, you create and trade with another to meet your needs. In a large scale, these selfish transactions help the system as a whole. Consumers make decisions to maximize own utility, firms for profits, governments for wealth and strength.
Price fluctuations set the equilibriums through voluntary exchange, without government intervention (free market). The problem that persisted with this, is the continuous creation of an immense amount of products and a free market that would decide where these products went, leading to either shortages or excesses.
Division of labor was one of the strongest points of the process. Think of one person having to mine the material needed for a craft, mix the materials required to make the end product, craft the item and prepare it for final use. Now think of many people, taking individual roles in the process, specialized in doing their part and sharing the outcome. Instead of hoarding gold, nations would distribute and create specialties, increase production and trade with other nations to maximize wealth.
Now instead of looking at this from the perspective of production, think of it from the perspective of the people. Think of the economy as a collection of individuals that place a value on things they purchase, based on the satisfaction these provide, rather than a random production line that does just that… produce.
Menger’s Austrian school, brought forward the theory of marginal utility. In essence, how much of an item, consumers are willing to purchase. For example, you can buy a toaster once, and be satisfied with its utility as many times as it can be of service. If you buy a second toaster, the satisfaction will not be the same as the first one, since you already have one that works. So how many toasters would need to be produced, depends on the importance of the toaster itself and how many people would purchase it.
Value therefore is not placed on the material, labor and costs but on how important the product is. Not only was the free market specializing people and produced more stuff, but since the same people in the free market bought the stuff, they were also deciding what’s important and needed to be produced. All without government intervention again, same as with the classical view.
And the economic cycles kept rising and falling, until the early 20th century, 1929 to be exact, when the great depression hit the world. And the cycles needed to be tamed, as they were spiraling out of control.
John Maynard Keynes (Keynesian) introduces measures to counteract the extreme effects and in 1936 writes the book “The General Theory of employment, interest and money”. And although the Austrian school debated that these measures tampered with the free market, the consumer’s sentiment became the priority. Who would have a positive sentiment to invest in a company, knowing that a recession is around the corner, about every 10 years more or less? The answer is nobody, but since companies still needed funding to produce and support the economy, why don’t we try to influence the consumer’s feelings (spending) by policies that tax them (take money out of their hands) when the economy is booming, and tax less (leave money in their hands) to spend during economic downturns and troughs.
The aim was to reduce the severity of excess and lack of, by smoothing the effects of each economic cycle through fiscal policy.
Monetary intervention, also known as Quantitative Easing/tightening became mainstream in 1995 when Richard Werner proposed it for the Bank of Japan, to help with the banking crisis and depression the country was going through at the time. Though proposed to increase the total transactions in Japan by encouraging banks to issue more loans (so for productive purposes), it was taken out of context encouraging purchase of securities and real estate. Meddling with the money supply in an economy is the basis of monetary policy, further seen in the 2008 Great Recession and every cycle that required interest rate hikes/cuts to reign down inflation.
The Japanese state of economy is a very interesting subject on its own. When you look at case studies of world economies, you consider developed economies, under-developed economies, Argentina (see last article) and Japan.
So what is Modern Monetary Theory?
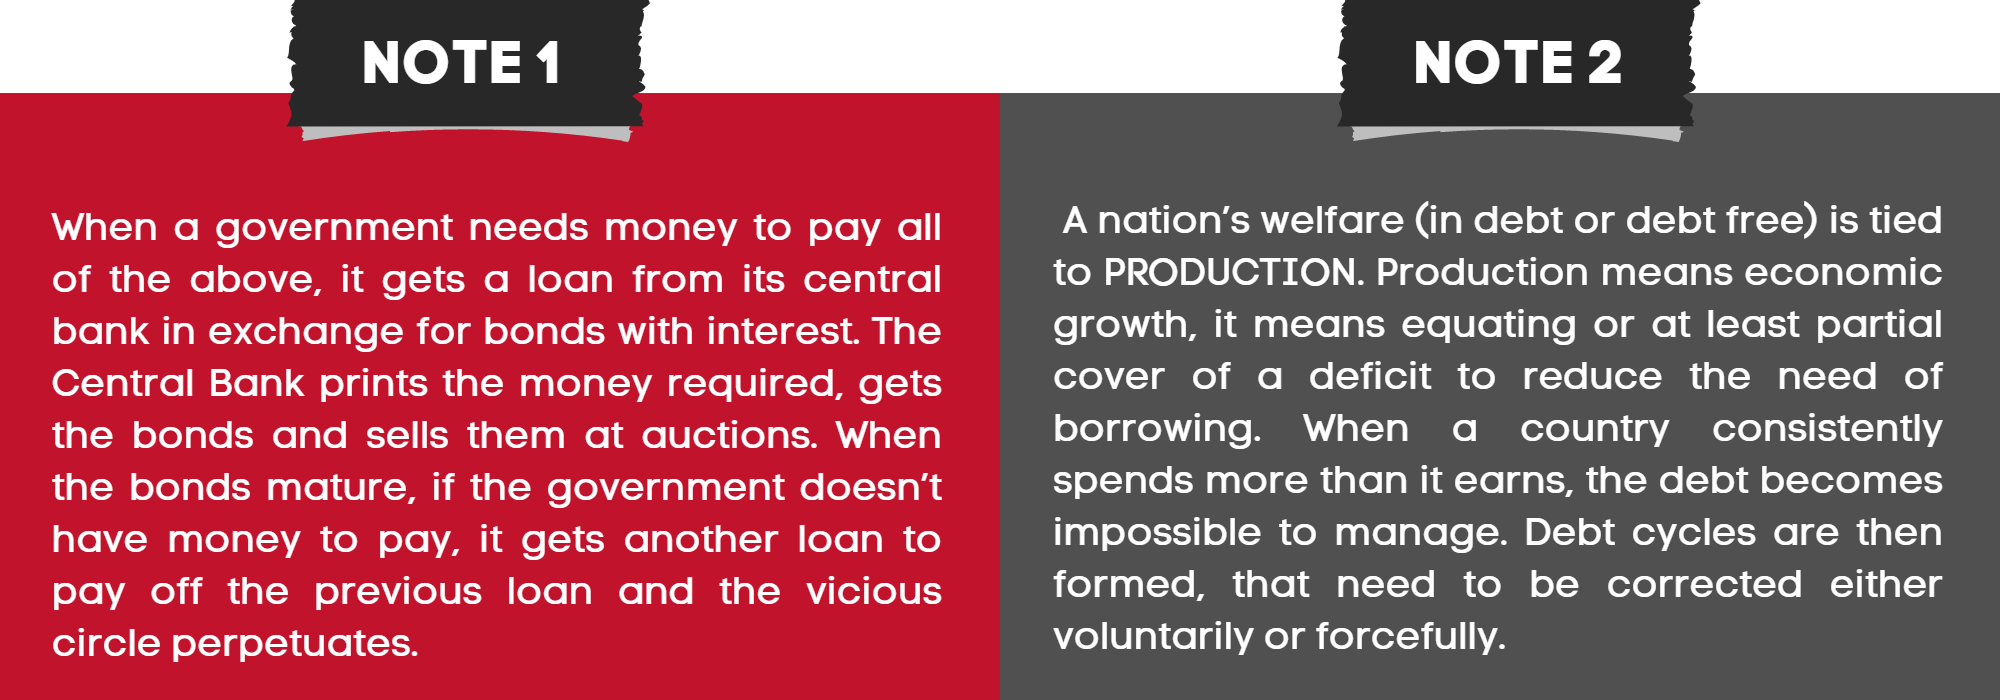
If you ask any central banker, they will either not know what this is, or refrain from talking about it altogether. Why is that? Before we dive into the intricacies of the concept, the general idea defies the traditional ways of a government book keeping i.e. earn more than you spend, collect money through taxes, work for budget surpluses, increase economic output/growth/GDP and pay back your debts with what you have. Not doing so, exacerbates national debt, makes you dependable on foreign and domestic creditors, bears the risk of default, eliminates credibility.
The easy way out, if possible and if you are monetary sovereign, is issuing bonds and printing new money to pay for debts and/or fund economic growth and/or pay for social programs, relief programs (like the pandemic relief programs) and so on.
Traditional economics (and past experience with Germany, Zimbabwe, Venezuela, Argentina) tell us that this “easy way out” leads to inflation and even worse hyperinflation. It leads to an exchange rate collapse due to the devaluation of the currency. To restructure your debts, you seek help from foreign lenders who will give you a loan – but in their currency. So your currency is devalued, its worth much less than the currency you’re borrowing, you have to pay back in that foreign currency, you need reserves to do that which you don’t have and the situation worsens, leading to defaults.
How does Modern Monetary Theory look into the above?
Imagine if the so called “easy way out” of printing money and taking care of all the issues, wasn’t as bad as you thought. Yes, there are examples of the demonized consequences actually materializing, but what if these consequences don’t apply to every nation, especially a nation with the size and influence of the US?
So in a nutshell, if you’re able and it serves your needs* you can print/create money out of thin air, you don’t need to worry about national debt, its ok to have budget deficits, all because you can afford it. You just print more of it and its all good. There’s no need of a collateral (bond) same as there was no need for gold peg, when Nixon took the US off the gold standard.
*by being able, we’re referring to sovereigns that have their own currency and can print at will. Eurozone countries for example can’t increase money circulation by printing more since the ECB mandates dictate circulation and it affects not just one country, but all of them.
*by serves your needs, we’re referring to the printing of new money servicing your debt and growth. Argentina borrowed from the IMF in dollars and needs to pay back in dollars. Since it prints pesos, it can’t really serve its debt needs that need to be repaid in dollars.
More on MMT
In essence, a government that issues its own fiat currency (not linked to a commodity), doesn’t have to rely on tax revenues to spend, it cannot be forced to default on debt issued in its currency (since it can print and pay it off), it is constrained only by inflation created when the economy is at full capacity/employment, it uses strengthened stabilizers like income taxes and social welfare to control aggregate demand, it issues bonds as a place for investors/other countries to place their money rather than funding itself.
Dr. Stephanie Kelton is a professor of economics, former Chief Economist to the US Senate Budget Committee and a big advocate of Modern Monetary Theory. She is regarded as a “heterodox economist”, a term that describes an economist who’s theories contrast with traditional schools of economics. Author of the book “The Deficit Myth”, Dr. Kelton circles around 6 myths regarding deficit.
- The myth that the Fed should bookkeep like a household
- Where did the Fed find the billions (close to trillion) dollars to bail out Wall Street in 2008? Where did the Fed find the 9 trillion since the beginning of pandemic (not just for covid but also for infrastructure and green projects) that brought US debt from 21 trillion to 30 trillion? Where did you see the effects other than a number of many zeros increasing next to the label “national debt”?
- The myth that deficits are evidence of overspending
- Inflation in the real economy is evidence of overspending, being the only constraint of MMT
- The myth that deficits will burden the next generation
- The national debt burdens no one. The government can print and pay back at will (on conditions that debt is in its own currency)
- The myth that deficits undermine long term growth
- Fiscal deficits increase people’s wealth and savings
- The myth that deficits make the US government dependent on foreigners
- US trade deficit is also its “product piling” surplus
- The myth that entitlement propels the US government toward a long-term fiscal crisis
- As long as the capacity of the economy allows it to produce needed items, it will always be able to support its welfare and social security programs.
Although the book received controversial feedback and commendations for its radical approach to modern economics, there is no right or wrong approach when dealing with unprecedented events.
Final thought on debt.
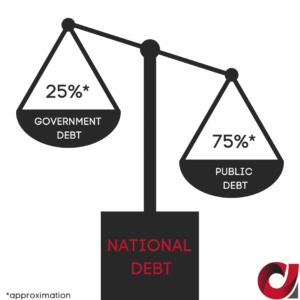
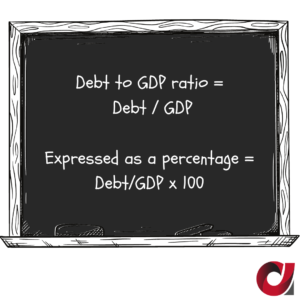
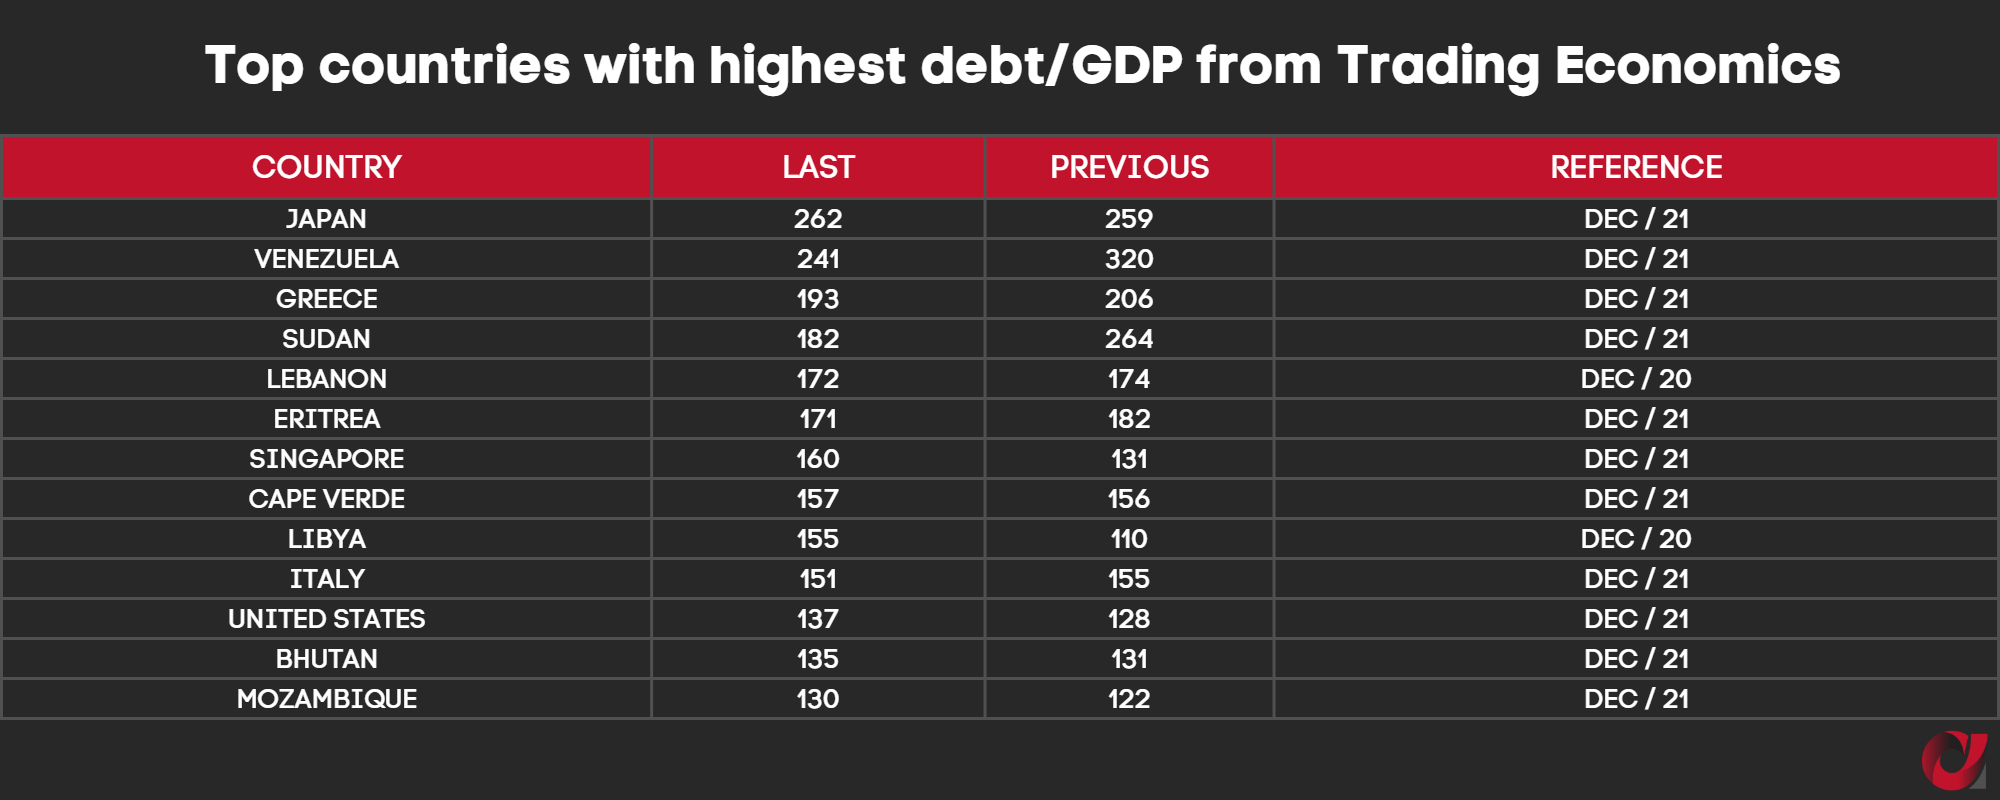
We cannot look into debt individually by ignoring a country’s capacity to pay it back. If I use my credit card and borrow $60,000 but only make $40,000, my capacity to pay back is very low. If I make $100,000, I can pay back easy and I can borrow more. That’s why debt to GDP ratios are important indicators of a nation’s ability to pay back its debts.
On our article on the slippery road of national debt, we gave some studies of good and bad ratios, of limits not to be crossed (like 90%) and the reasons why. Bottom line is that passing a critical threshold (say its 90% for the sake of argument), the growth output for every dollar I borrow is hindered, to the point of making no difference. For example, at 30% debt/GDP, for every $1 dollar I borrow, I could have a hypothetical output of $1.30. So my borrowed dollar has been put to good use. For every percentage increase in the debt/GDP (40,50,60%) this output goes down to $1.20, $1,10, $1.00. Passed 90%, the $1 I borrow produces $0.95 (less than what I borrowed) and it doesn’t get any better moving forward. You see where this is going with debt-to-GDP ratios of Japan, Australia and Venezuela at 260%, Singapore at 170%, Greece at 166%, Italy at 140%, the US at 124%, France at 110% and many more above the 90% threshold (as of the time writing this article).
Productive spend and growth, rather than inflating the bank accounts of the wealthy that only hoard and don’t put back into the system, will always balance nations irrespective of whether economics is a science or not. A laughing matter for those who consider themselves “real scientists” but a matter debated to date nonetheless.
The information provided is strictly for informational use and is not meant in any way to be construed as investment advice. One should seek expert advice, as all investment strategies involve risk of loss.
___________________________
More interesting topics to look into:
Capital Markets Training – for corporations and individuals
Forex White Label – Discover it all, requirements and options
EU Tied Agent – Should you consider it or not?
Forex jurisdictions – EU and Offshore with country stats and listed brokers
Start your Brokerage business by:
Connecting offshore: With our clients in Belize, Seychelles, the Caymans, Martial Islands and St. Vincent offering the most flexible IB and White Label solutions.
Connecting in the EU: With our clients in 15 out of the 28 member states offering strong partnerships to individuals and corporations with existing client base, looking to connect.
Contact us for a private conversation to discuss your case through the contact form or one of our emails at info@allfx–consult.com, partners@allfx-consult.com.
#startaforexbrokerage #ib #forex ib #whitelabel #forexwhitelabel #tied agent #regional partner #forexlicense #forexoffshorelicense
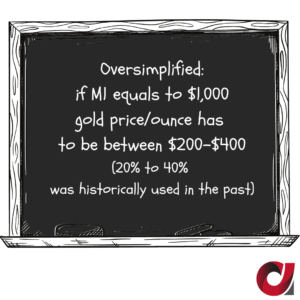 M1 is a measure of money supply (measuring from M0-M3). M1 is also known as narrow money, all the currencies and assets that can be easily converted into cash. The further you go on the M scale, the broader the money it measures and the less liquid (easily convertible to cash) the assets are. Rickards explained that 20-40% of M1 is historically a workable percentage used, when money was pegged to gold in the past (see image). The law in the US from early 1900s to 1950s said that gold price multiplied by the amount of gold in reserves had to amount to 40% of total money supply (Federal Reserve Act of 1913). Due to the Vietnam war and the need for money, they had to curtail the law, but 40% worked just fine. He also said that the Bank of England in the 1800s managed a successful gold standard when Britain became dominant power after the fall of Napoleon and until WW1 with 20% gold backing the money supply.
 Last but not least, there is a reason credit/debt is not taught the way it should to youngsters in schools. Keeping the majority
 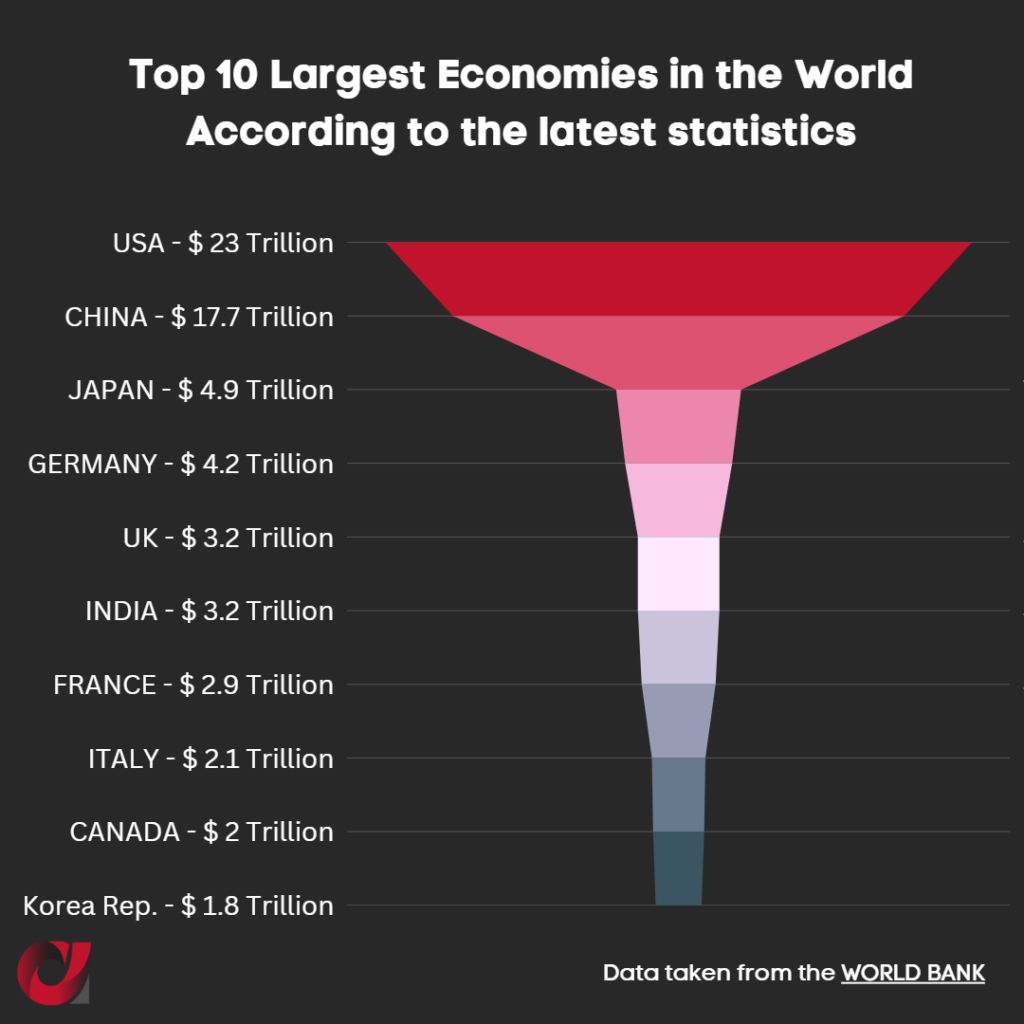 When other sovereign nations are using your currency as their own, when over 65 countries peg their currency to yours, and when over 90% of forex trading involves your currency, you know you dominate. On the other side, when your GDP starts to decline at the same time that the GDP of competing countries is on the rise (with outlook of surpassing you) and/or when you are repositioned as a major partner in the global arena (EU exchanged more goods with other partners in 2021 compared to the US), you know that times might be changing.
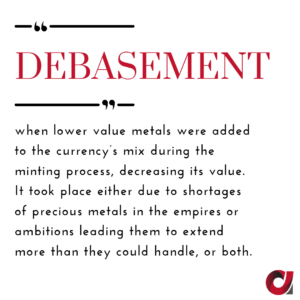 And in all of the above, the country standing at the top of the podium was constantly challenged leading to conflicts and wars, the necessary funding of these wars, retreats and abdications, debasement (see image) of the currencies, ultimately leading to the fall of one empire and the rise of another.
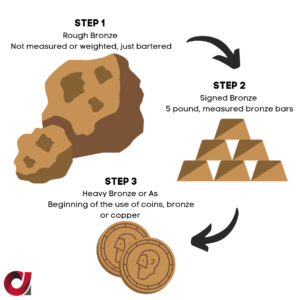 Metals (precious as well as common) were used for bartering. Going back to 200 BC as an example, Bronze was heavily used as a medium of exchange, not so much for its value, as much for its crafting qualities (easily turned into tools or something else). The evolution of Bronze as a medium of exchange can be seen in the following steps (see image)
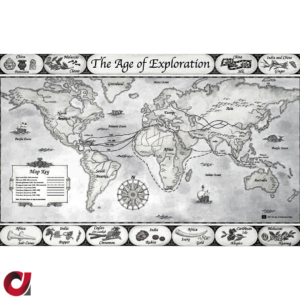 Trade routes at that time, were all land locked. Traders were still exploring to find safe passages and it wasn’t until approx. 110 BC that the Silk Route was established connecting China and Southeast Asia with Africa and Europe. Trade routes via sea, were recorded during the Age of Discovery/Age of Exploration. That was when European countries wanted to explore the world in the 1400s. It opened up a world of opportunities as well as brutal competition, which led to the discovery of the Americas as well as new trade routes to India and the Far East.