Debt – Could modern monetary theorists (MMT) be our ladder out of the pit? We’ll look into it, but not before we take you through the traditional schools of thought


“Debt is the slavery of the free” said Publilius Syrus. Depending on whom you ask i suppose. Modern monetary theorists believe we can print our way through any obligation as long as certain conditions are met. We’ll get there eventually but not before we go through older schools of thought and how economics evolved through the years.

Great debates (that are not searching for a winner but the truth), make people, well… better people. In our search for arguments to support an idea, we end up revealing so much about ourselves and others. A real search also paints a more pragmatic picture of what’s happening around us, without restraints and blinkers of orthodox or unorthodox statements. In a nutshell, just because someone says something is true and everyone goes along with it, it doesn’t have to be the one and only correct statement.

A friend asked the other day if economics is a science. And there you have it… we ended up rolling up our sleeves and debating some fascinating subjects that made a nice salad, interesting enough to put in today’s topic.


So what is science?

For a field of study to fit the framework of science, it needs to collect and analyze data, present objective hypothesis and theories that can be tested in controlled environments, and finally come up with agreed and irrefutable true/false results.


Does this apply with economics?

Every economic model was founded on solving a fundamental problem. The problem is that there is a finite (limited) amount of resources for product output, while the demand for human consumption of goods/services is essentially limitless.

By nature the problem has no solution. New economic theories cannot be tested in controlled environments. They would need to be applied in everyday life, but it they go bad, they can go really bad. Imagine the implications of a newly applied economic theory that plays with debt, income and spend, with all of them impacting directly everyone’s daily life.

For this reason, economics have always been regarded as a social science more than anything.


Social science and the evolution of economics.


In the old days, people produced what they needed to produce, then they collectively produced and shared the benefits, then they produced what was needed and desired, all within a framework believed to be a free market. This free market set its own prices and rules of trade, without external intervention.

Then along came hard recessions a.k.a. depressions, and intervention was needed to contain an out-of-control spiral of business cycles (from boom to recession and back to boom again).

The evolution took place in a world where nations didn’t know economics and all they knew was hoarding precious metals i.e. silver/gold, to the creation of schools of thought that studied how the world operated to increase the wealth of nations – which was the foundation of economics – and finally with governments intervening through their policies to smooth out these business cycles.

These schools of thought from Smith’s Classical, to Menger’s Austrian, and Keynes’s Keynesian, played their role in how we approach economics today. There’s a new school of thought, very interesting to look into as well called the Modern Monetary Theorists (MMT). More on MMT below.


The economic schools in a nutshell


Adam Smith’s classical view, studied how nations operated to increase their wealth. This view argues that we can make the world a better place by being extremely selfish. By making the best decision for yourself, you create and trade with another to meet your needs. In a large scale, these selfish transactions help the system as a whole. Consumers make decisions to maximize own utility, firms for profits, governments for wealth and strength.

Price fluctuations set the equilibriums through voluntary exchange, without government intervention (free market). The problem that persisted with this, is the continuous creation of an immense amount of products and a free market that would decide where these products went, leading to either shortages or excesses.

Division of labour was one of the strongest points of the process. Think of one person having to mine the material needed for a craft, mix the materials required to make the end product, craft the item and prepare it for final use. Now think of many people, taking individual roles in the process, specialized in doing their part and sharing the outcome. Instead of hoarding gold, nations would distribute and create specialties, increase production and trade with other nations to maximize wealth.

Now instead of looking at this from the perspective of production, think of it from the perspective of the people. Think of the economy as a collection of individuals that place a value on things they purchase, based on the satisfaction these provide, rather than a random production line that does just that… produce.


Menger’s Austrian school, brought forward the theory of marginal utility. In essence, how much of an item, consumers are willing to purchase. For example, you can buy a toaster once, and be satisfied with its utility as many times as it can be of service. If you buy a second toaster, the satisfaction will not be the same as the first one, since you already have one that works. So how many toasters would need to be produced, depends on the importance of the toaster itself and how many people would purchase it.

Value therefore is not placed on the material, labour and costs but on how important the product is. Not only was the free market specializing people and produced more stuff, but since the same people in the free market bought the stuff, they were also deciding what’s important and needed to be produced. All without government intervention again, same as with the classical view.

And the economic cycles kept rising and falling, until the early 20th century, 1929 to be exact, when the great depression hit the world. And the cycles needed to be tamed, as they were spiralling out of control.

John Maynard Keynes (Keynesian) introduces measures to counteract the extreme effects and in 1936 writes the book “The General Theory of employment, interest and money”. And although the Austrian school debated that these measures tampered with the free market, the consumer’s sentiment became the priority. Who would have a positive sentiment to invest in a company, knowing that a recession is around the corner, about every 10 years more or less? The answer is nobody, but since companies still needed funding to produce and support the economy, why don’t we try to influence the consumer’s feelings (spending) by policies that tax them (take money out of their hands) when the economy is booming, and tax less (leave money in their hands) to spend during economic downturns and troughs.

The aim was to reduce the severity of excess and lack of, by smoothing the effects of each economic cycle through fiscal policy.

Monetary intervention, also known as Quantitative Easing/tightening became mainstream in 1995 when Richard Werner proposed it for the Bank of Japan, to help with the banking crisis and depression the country was going through at the time. Though proposed to increase the total transactions in Japan by encouraging banks to issue more loans (so for productive purposes), it was taken out of context encouraging purchase of securities and real estate. Meddling with the money supply in an economy is the basis of monetary policy, further seen in the 2008 Great Recession and every cycle that required interest rate hikes/cuts to reign down inflation.

The Japanese state of economy is a very interesting subject on its own. When you look at case studies of world economies, you consider developed economies, under-developed economies, Argentina (see last article) and Japan.


So what is Modern Monetary Theory?


If you ask any central banker, they will either not know what this is, or refrain from talking about it altogether. Why is that? Before we dive into the intricacies of the concept, the general idea defies the traditional ways of a government book keeping i.e. earn more than you spend, collect money through taxes, work for budget surpluses, increase economic output/growth/GDP and pay back your debts with what you have. Not doing so, exacerbates national debt, makes you dependable on foreign and domestic creditors, bears the risk of default, eliminates credibility.

The easy way out, if possible and if you are monetary sovereign, is issuing bonds and printing new money to pay for debts and/or fund economic growth and/or pay for social programs, relief programs (like the pandemic relief programs) and so on.

Traditional economics (and past experience with Germany, Zimbabwe, Venezuela, Argentina) tell us that this “easy way out” leads to inflation and even worse hyperinflation. It leads to an exchange rate collapse due to the devaluation of the currency. To restructure your debts, you seek help from foreign lenders who will give you a loan – but in their currency. So your currency is devalued, its worth much less than the currency you’re borrowing, you have to pay back in that foreign currency, you need reserves to do that which you don’t have and the situation worsens, leading to defaults.


How does Modern Monetary Theory look into the above?


Imagine if the so called “easy way out” of printing money and taking care of all the issues, wasn’t as bad as you thought. Yes, there are examples of the demonized consequences actually materializing, but what if these consequences don’t apply to every nation, especially a nation with the size and influence of the US?

So in a nutshell, if you’re able and it serves your needs* you can print/create money out of thin air, you don’t need to worry about national debt, its ok to have budget deficits, all because you can afford it. You just print more of it and its all good. There’s no need of a collateral (bond) same as there was no need for gold peg, when Nixon took the US off the gold standard.

*by being able, we’re referring to sovereigns that have their own currency and can print at will. Eurozone countries for example can’t increase money circulation by printing more since the ECB mandates dictate circulation and it affects not just one country, but all of them.

*by serves your needs, we’re referring to the printing of new money servicing your debt and growth. Argentina borrowed from the IMF in dollars and needs to pay back in dollars. Since it prints pesos, it can’t really serve its debt needs that need to be repaid in dollars.


More on MMT


In essence, a government that issues its own fiat currency (not linked to a commodity), doesn’t have to rely on tax revenues to spend, it cannot be forced to default on debt issued in its currency (since it can print and pay it off), it is constrained only by inflation created when the economy is at full capacity/employment, it uses strengthened stabilizers like income taxes and social welfare to control aggregate demand, it issues bonds as a place for investors/other countries to place their money rather than funding itself.

Dr. Stephanie Kelton is a professor of economics, former Chief Economist to the US Senate Budget Committee and a big advocate of Modern Monetary Theory. She is regarded as a “heterodox economist”, a term that describes an economist who’s theories contrast with traditional schools of economics. Author of the book “The Deficit Myth”, Dr. Kelton circles around 6 myths regarding deficit.

  • The myth that the Fed should bookkeep like a household
    • Where did the Fed find the billions (close to trillion) dollars to bail out Wall Street in 2008? Where did the Fed find the 9 trillion since the beginning of pandemic (not just for covid but also for infrastructure and green projects) that brought US debt from 21 trillion to 30 trillion? Where did you see the effects other than a number of many zeros increasing next to the label “national debt”?
  • The myth that deficits are evidence of overspending
    • Inflation in the real economy is evidence of overspending, being the only constraint of MMT
  • The myth that deficits will burden the next generation
    • The national debt burdens no one. The government can print and pay back at will (on conditions that debt is in its own currency)
  • The myth that deficits undermine long term growth
    • Fiscal deficits increase people’s wealth and savings
  • The myth that deficits make the US government dependent on foreigners
    • US trade deficit is also its “product piling” surplus
  • The myth that entitlement propels the US government toward a long-term fiscal crisis
    • As long as the capacity of the economy allows it to produce needed items, it will always be able to support its welfare and social security programs.

Although the book received controversial feedback and commendations for its radical approach to modern economics, there is no right or wrong approach when dealing with unprecedented events.


Final thought on debt.


We cannot look into debt individually by ignoring a country’s capacity to pay it back. If I use my credit card and borrow $60,000 but only make $40,000, my capacity to pay back is very low. If I make $100,000, I can pay back easy and I can borrow more. That’s why debt to GDP ratios are important indicators of a nation’s ability to pay back its debts.

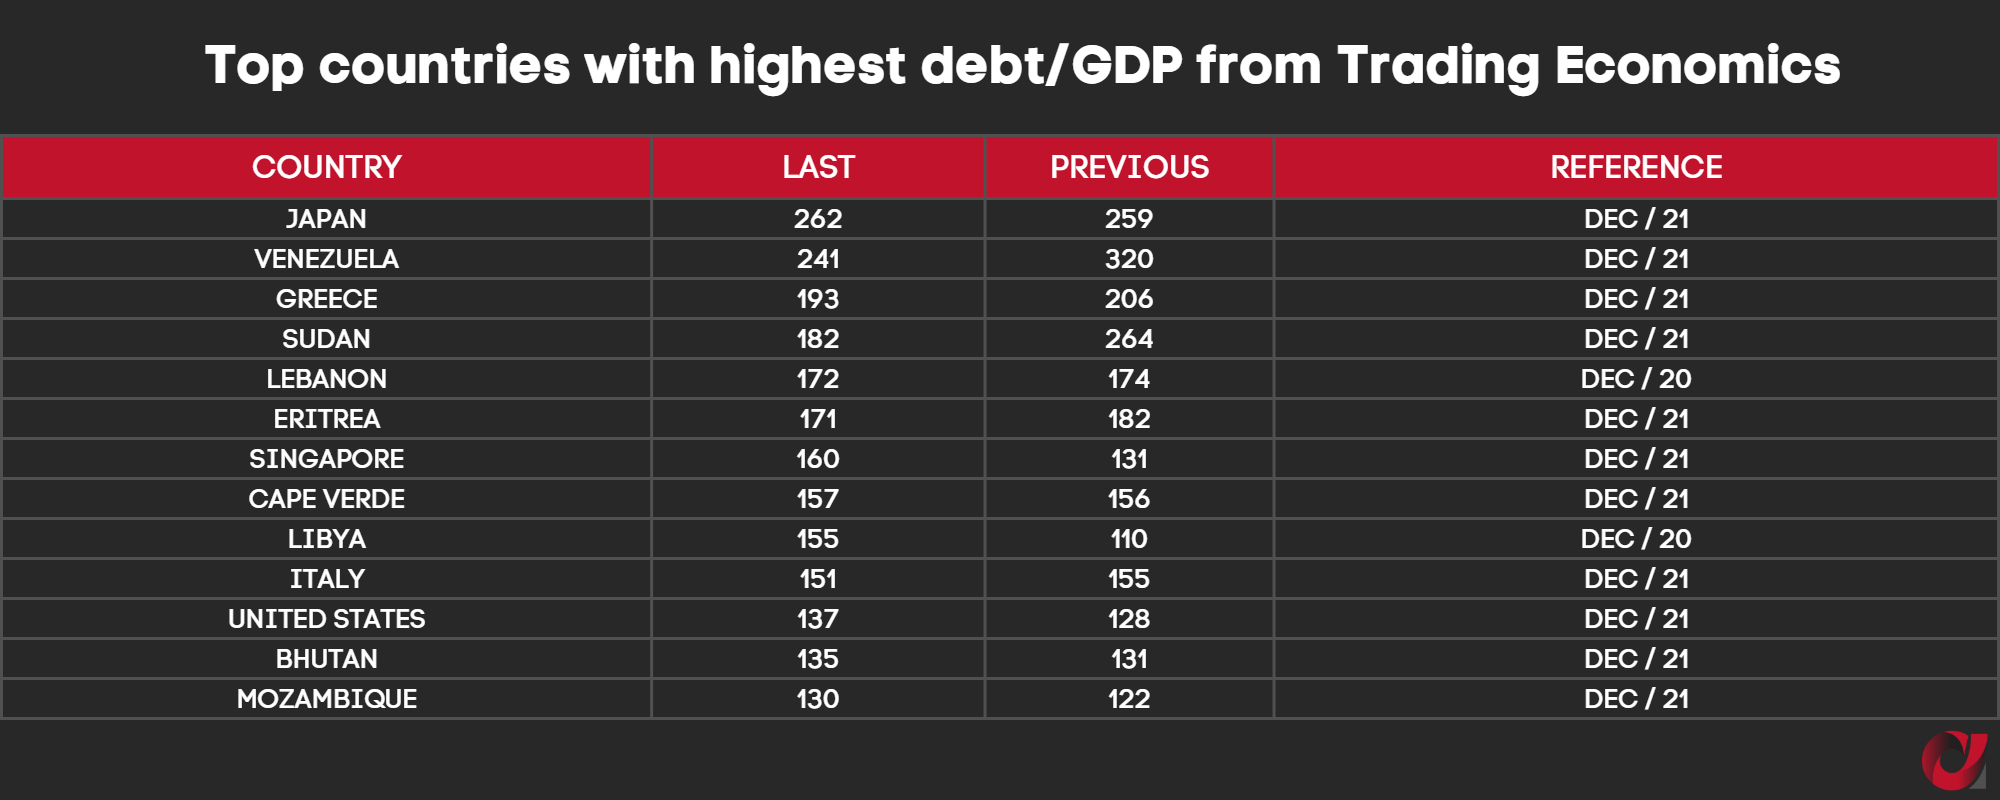
On our article on global debt, we gave some studies of good and bad ratios, of limits not to be crossed (like 90%) and the reasons why. Bottom line is that passing a critical threshold (say its 90% for the sake of argument), the growth output for every dollar I borrow is hindered, to the point of making no difference. For example, at 30% debt/GDP, for every $1 dollar I borrow, I could have a hypothetical output of $1.30. So my borrowed dollar has been put to good use. For every percentage increase in the debt/GDP (40,50,60%) this output goes down to $1.20, $1,10, $1.00. Passed 90%, the $1 I borrow produces $0.95 (less than what I borrowed) and it doesn’t get any better moving forward. You see where this is going with Japan, Australia and Venezuela at 260%, Singapore at 170%, Greece at 166%, Italy at 140%, the US at 124%, France at 110% and many more above the 90% threshold.

Productive spend and growth, rather than inflating the bank accounts of the wealthy that hoard and don’t put back into the system, will always balance nations irrespective of whether economics is a science or not. A laughing matter for those who consider themselves “real scientists” but a matter debated to date nonetheless.


The information provided is strictly for informational use and is not meant in any way to be construed as investment advice. One should seek expert advice, as all investment strategies involve risk of loss.


You might find this interesting


Capital Markets Training – for corporations and individuals

Forex White Label – Discover it all, requirements and options

EU Tied Agent – Should you consider it or not?

Forex jurisdictions – EU and Offshore with country stats and listed brokers


Start your Brokerage business by:


Connecting offshore: With our clients in Belize, Seychelles, the Caymans, Martial Islands and St. Vincent offering the most flexible IB and White Label solutions.

Connecting in the EU: With our clients in 15 out of the 28 member states offering strong partnerships to individuals and corporations with existing client base, looking to connect.

Contact us for a private conversation to discuss your case through the contact form or one of our emails at info@allfx–consult.compartners@allfx-consult.com.


#startaforexbrokerage #ib #forex ib #whitelabel #forexwhitelabel #tied agent #regional partner #forexlicense #forexoffshorelicense


A new era dawns on Argentina – an excellent case study to learn from or cavy of unorthodox ideologies with potentially disastrous effects?


A land of legends by the name of Lionel Messi and Diego Maradona! Could we include Pope Francis here too? He does get a near 2% admiration by the population of Argentina (on Statista) among former presidents and TV hosts.

Past is in the past though and a new sunrise, shines on one of the most beautiful countries and 3rd largest economy of South America after Brazil and Mexico. Javier Milei defeats Sergio Massa in the 2023 Argentine general elections, after winning the run-off round by 3 million votes, and a decision of the latter to concede.


Who is Sergio Massa? Argentina’s Minister of Economics since 2022, he run for President in the 2015 elections, where he lost from Mauricio Macri, yet another Argentine favourite (again based on Statista). With media pinning current inflation numbers (more like hyperinflation of 143%) on current government policies (including Massa’s) and associating the bad economic stance on the country to dark politics of the past, Argentina voted for a different future, calling for drastic change and reformation measures.


Why is this a new era for Argentina though?

Well, Argentines are celebrating Milei’s victory by chanting “out with all of them”. If that doesn’t describe their views on past leadership, maybe Milei’s anarcho-capitalist campaign on reconstructing Argentina by shutting the Central Bank, dollarizing the economy and embracing decentralizing finance, can. Which is the reason why we’re writing about this. And if this is not painting a picture of what’s coming, take a 15% spending cut by shutting down ministries of culture, education and diversity, and also by eliminating public subsidies and there you have it.


Note on Argentina’s public subsidies:

In a study on “The Incidence of Subsidies to Residential Public Services in Argentina: The Subsidy System in 2014 and Some Alternatives” by CHRISTOPH LAKNER, MARIA ANA LUGO, JORGE PUIG, LEANDRO SALINARDI and MARTHA VIVEROS, they write:

“Though subsidies can be a tool to protect the poor, in Argentina they led to distortions and a large share have been absorbed by upper classes and non-residential consumers.

In 2015, electricity bills reflected less than 10% of production costs and lower tariffs have led to an increased demand of public services. Not only have energy and transport subsidies distorted both demand and supply, they have also not been efficiently targeted to the poor; instead, they have been distributed across all income groups, with the non-poor receiving the largest shares.”

Although we are writing about Argentina for its economic reformation plans primarily, we can’t fail to mention that the new administration will be seismically shocking social issues as well, like regulations on gun control, abortion, private education and the privatization of the health sector.

It’s also worth mentioning that worldwide through history, social distress/unrest always called for change, whether an extreme leftist movement (Marxist ideology of proletariat uprising) or extreme right (fascist/nationalist movements and demagogues with more devious plans than just the reformation of a country).

Now that we have a prelude, what is the context of today’s topic? Politics and social issues aside, we’ll only touch on the economic reformations i.e. the Central Bank shutdown, the dollarization concept, the huggzies on decentralized finance with a pro-Bitcoin stance and its integration into the economy (following El Salvador). Will he legally tenderize Bitcoin in the country like a prime beef cut? Remains to be seen.


Happening now and reasons leading up to this


To begin with, why don’t we try and put some context to the Argentine economy, and then see what makes these elections different from the rest, and why these economic reforms are of interest moving forward.


Argentina as of 2023:

Population 46 million
National Debt Over $400 billion ($43 billion is owed to IMF)
GDP Over $600 billion
Unemployment Rate 6.2%
Inflation Rate 143%
Interest Rate 133%
Poverty Rate 40%


As of late (since the country has been in economic turmoil for decades), Argentina was in a recession because of the pandemic like many other countries. In its 3rd year of droughts, pain was felt on its agricultural sector affecting soy, beef and wheat to say the least. Based on the International Production Assessment Division of the US, production yield – measured in Tons/Hectare – dropped since 2021 like so:

  • Wheat: from 3.4 to 2.3 and up to 2.7
  • Rice: from 7.3 to 6.6 and up to 6.8
  • Barley: from 4.0 to 2.9 and up to 3.6
  • Corn: from 7.9 to 5.1 and up to 7.7
  • Soybean: from 2.8 to 1.7 and up to 2.9


Argentina’s natural resources


First and foremost, any country’s best natural resource are its people. Argentines are beautiful people, highly educated and outspoken. Maybe a shocking political reformation like this one, is what the country needs so that Argentines can finally shine the way they should.


The country has the 3rd largest lithium deposits (after Australia and Chile), with 70% not yet exploited.

  • Lithium is used in batteries, a big component in the global energy transition, its used in medication treating bipolar disorders, it’s also used in glass/ceramics (stovetops, fiberglass) due to its corrosion resistance and durability.


Hydrocarbons

  • The 2nd largest shale gas formation (802 TCF) after China (1,115 TCF)
  • The 4th largest oil shale formation (27 billion barrels) after Russia, US and China
  • Large initiatives were taken by previous administrations for green energy transition (solar and wind) as part of the global climate change efforts. Another interesting view of the new administration is that climate change is a “socialist lie”. Milei also said that should he come to power, a company could pollute a river without restrictions. I hope there is humor somewhere in this sentence that I don’t see, because if not, in the name of economic reformation people voted for future green babies with 4 fingers, a tail and no toes.


Agriculture

  • Sector accounts for a quarter of the country’s exports.
  • 4th largest producer of soy worldwide.
  • Produces maize (corn), wheat, cotton, sunflower seeds and more


Mining Portfolio

  • $30 billion worth of mining portfolio via 113 projects, 26 of which are in production and under construction.
  • Further to lithium and energy, Argentina has deposits of copper, aluminum, uranium (40K tons, ranking 19th by reserves), iron, zinc, boron (used in fertilizers, insecticides, borax, fiberglass etc), potash (used in fertilizers)
  • Argentina shares the same mountains with Chile, the largest copper exporter in the world (with revenue of $23 billion in 2022). To understand how behind in international trade Argentina is, it has large amounts of copper deposits like Chile, but exports none of it. That’s why 50% of the projects in the mining portfolio mentioned above, relate to copper.


Argentina’s debt

Attributed solely to economic mismanagement – we’ve written about Argentina’s debt in previous articles – so a generic characterization would be a serial defaulter. Since 2001, the country defaulted already 3 times on its national debt.

  • 2001 in the middle of a financial crisis
    • Argentina was under military dictatorship (junta) from 1976-1983. New government reforms lead to hyperinflation of 200% by July 1989, president Alfonsin resigns.
    • 1990s saw fixing the exchange rate of its currency to USD, tax evasion and money laundering, lower tax revenues and large amounts of borrowing by president Menem.
    • Recession started in 1998, characterized as the great depression of Argentina, lasted for 3 years
    • Argentina defaults on $132billion
  • 2014 in the middle of a battle against holdout creditors. 3 options were at play:
    • Pay creditors. Given the debt burden it was rejected by the government.
    • Negotiate a deal. Regarded as a win-win, but the political cost on the government would have been too big. Also rejected by the government.
    • Selective default. Which was chosen, and its economic/social implications are still felt to date.
  • 2020 – middle of Covid 19 pandemic
    • Yet another debt restructure, failing to pay half a billion to its creditors, Argentina defaults on its payments.


So can a country can survive without a Central Bank?

Weirdly so yes it can. Central Banks became mainstream in the 17th century. Prior to that, monetary policy was managed by the country’s Treasury. Though it was also a time when Gold and Silver were the currency, accepted and recognized across the board.

Taking this a step further, if a country doesn’t have its own currency (so it kinda outsources the situation) then what would the real implications be, if no Central Bank was present? Do Eurozone countries need a Central Bank since they outsource their currency to the ECB? Take Andorra and Monaco as an example, both in the Eurozone, without a Central Bank of their own doing just fine. Or Liechtenstein with the Swiss Franc for that matter. Tiny countries, I know, but doesn’t science begin with small controlled experiments, and based on their success decide on a True/False result?

This being said, the Central Banks have an independent role to play in a country’s economics, a weapon against manipulation and fraud by their own governments. Although this is dependent largely on the role of the Central Bank in the county and the control that the government has on its functions.

The three largest cases we could look into to review this, would be the US Fed, Europe’s ECB and China’s PBC. In the US, the Federal Reserve is authorized by Congressional law, so that a president can’t order the Fed to print money on a tantrum (for example billions of starched dollars, fresh off the press, and instead of being used to support the US citizens and a $34 trillion indebted economy, we see them being used abroad in wars/fights that have nothing to do with their own economic growth. Not judging of course, justified help should always be present by stronger countries to weaker ones, hopefully on the premise of human rights to freedom, rather than the fear of a bond selloff or monetary interests (more on this another time).

Also, on a random note, not sure if calling country leaders names (like dictators) ever served properly geopolitical relations, but a US president did call a Russian president a dictator, right before the Ukrainian war, and a US president did call a Chinese president a dictator, right before a potentially upcoming Cold War. Wait a minute… isn’t it the same president that keeps throwing the D word around, like popcorn on the head of the person sitting in front of you at the movies, that just won’t stop talking… Nahh, the name calling can’t be related to any international events…

So the Fed is authorized by Congress. The ECB is run as a result of an international treaty, with a Euro independent of national governments, raising the question again whether a Central Bank is needed or not. In China, the system is deliberately set up so that the president can indeed order the PBC to do things. A gift from a Marxist/Leninist ideology that may serve well or not, but serves nonetheless.


What is up with dollarization and how far back can we go to understand this?

1946 saw Peron come into power, inspired by nationalist movements in Europe, including Italy’s Mussolini. Together with a strong labour movement (he favoured the workers by increasing wages, welfare programs etc) and cutoff the country from international trade. Peronists are his legacy, in power for the majority of the past 2 decades (including the Kirchner husband and wife (2003-2007 president Nestor Kirchner and his wife Cristina Kirchner, president from 2007-2011, re-elected president from 2011-2015, and emerged again as vice president, in the last administration from 2019 to date).

This nationalist behaviour, combined with the decoupling from international trade and huge spending for the public, needed money. Government was printing money, because it could, to tackle with excessive fiscal deficits and the more it printed, the worse inflation became. Too much money pumped into the economy, chasing too few goods, is the definition of hyperinflation. Local stores would set a price for their products in the morning, and reprice them in the afternoon. That’s how quickly conditions changed. They worked for nothing because they earned nothing.


Argentines had to get creative.

Saving in the local currency, the Argentine Peso, with the numbers experienced over the last decade had little to no impact. So they started saving in USD a long time ago. A problem of its own though, since government controls allowed people to exchange only up to $200 a month at the official exchange rate. Currency black markets took advantage of the opportunity and Argentines illegally (but understandably) went with it, in an effort to hold some value in their money. To put things in perspective, the official rate for 1 USD was 360 pesos. Through black markets, 1 USD is 760 pesos.

Soybeans in Argentina have an export tax of 33%. If the export price is 1,000 dollars, the government takes 33% or $333, and the farmer the remaining $667. The farmer will exchange these dollars for pesos at the official exchange rate. When the dollar rate is bad, farmers have to make a decision between exchanging now at a bad rate, or exchanging later at a better price, or holding the produce in storage until a better price is at play. Dollars in the hands of people, empty coffers in the hands of the government.

Soy dollar (dolar soja) was the solution to this. Better exchange rate provided by the government specifically for soya sales and exports. In September 2022, the first plan brought in $7,5 billion in revenue, the 2nd in December 2022 brought in $3 billion, the 3rd plan in April 2023 brought in $5 billion and the 4th plan in August 2023 brought in $2.1 billion.


So how do we dollarize the economy?

Countries did it in the past like Panama, Ecuador and El Salvador, though none of the size of Argentina and especially with a poverty rate at 40%. To dollarize you need a stable economy and build foreign exchange reserves. You need access to capital markets and prudent reductions in fiscal spend. You need internal trust – your own people need to trust that it’s the way forward with short term pain and long term gain. And you need external trust – outside lenders and investors trusting that there is potential in the plan. With Argentina defaulting so many times, no one wanted to lend them money. Except the IMF. The debt to the IMF is double the one of Egypt, the second largest IMF borrower. Following is Ukraine, Pakistan, Ecuador, Colombia and African countries.


Does Milei have the trust – both internal and external – willing to do whatever to reign down the problems at hand and make “Argentina great again” like Donald Trump said to him after his win?

We sure hope so, because other than the fact that Argentina is a beautiful country, and other than the fact that it has highly educated and smart people, it also has the potential to increase its output exponentially and become a solid partner in the world stage.

The slippery road of National Debt

If you owe your bank $100, you have a problem. If you owe your bank $1 million, your bank has the problem. It mattered I guess when this quote was popularized by Keynes, but I’m having a hard time wrapping my head around the number 300 trillion, let alone managing it. Global debt is an all-inclusive number though, comprised of sovereign debt, corporate debt and household debt. And since its unmanageable even by the best homo sapiens, we’ll take a closer look at the national debt in today’s discussion and the current situation surrounding it.

National debt is the total amount of outstanding borrowed sums (pending to be paid), accumulated over a nation’s history. Nations make money from tax revenue and they spend them for social welfare, infrastructure and to promote growth. When they spend more than they make, they accumulate deficits which are paid by borrowing. Borrowing comes in the form of bonds, which is a security issued with a maturity date, that pays back the loan plus an interest. The collective accumulated amount borrowed plus the promised interest constitutes the national debt.


national debt


national debt

Where does borrowing come from?


Borrowing can come from anywhere. It’s split into debt held by the public and debt held by the government (intragovernmental). The debt held by the public is held by state/local governments, pension funds, mutual funds, corporations, individuals and foreign nominal/legal persons. The debt held by the government is the amount of debt that the government owes to itself. It is held mostly by government trust funds like social security trusts and insurance trusts. In approximate proportion of 75% for public debt and 25% for government debt, both form the overall national debt. Denmark and the US have a debt ceiling in place.

Debt ceiling? A debt limit that – by law – cannot be passed. If the country reaches this limit, it can no longer get money via borrowing, it can no longer use debt to pay for obligations, fund social programs and services. And like in all things financial, there’s an irony to this as well. Denmark never reached its debt ceiling – almost did with the 2007 crisis – but they increased the limit so high, they can never possibly reach it again. The US reached theirs – 78 times to be exact since 1960 – and increased it, reached it and increased it again and again, you see where I’m going with this. The current US debt ceiling is at $31.4 trillion. The current US national debt is at $30.93 trillion. What’s next? 


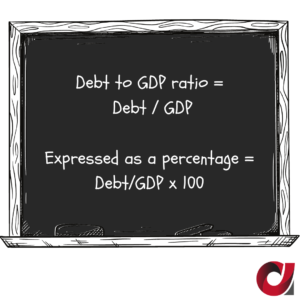
Debt to GDP ratio 

allfx consult


Largely related to the 2007 financial crisis as well as the COVID 19 pandemic, the debt was accumulated to avoid defaults (bankruptcies), protect lives and retain unemployment at manageable levels. According to the IMF, global debt rose to $226 trillion in 2020. Compared to the global GDP, you get a 256% global debt to GDP ratio.

Can these numbers be reduced? How fast and how? More borrowing to pay past borrowing? And if not, what are we to make of this masterpiece?


What do these numbers mean in a context that we can understand?

The World Bank conducted a study in July 2010 called “Finding the Tipping Point-When Sovereign Debt Turns Bad”, that placed lines not to be crossed by countries. If crossing the line is only for short term periods like small recessions, it shouldn’t have much of an effect on productivity. If crossed and extended for longer periods like decades, economic growth is likely to be hindered. Based on its samples of advanced and developing countries, between 64%-77% debt to GDP was found to be a proper estimate.

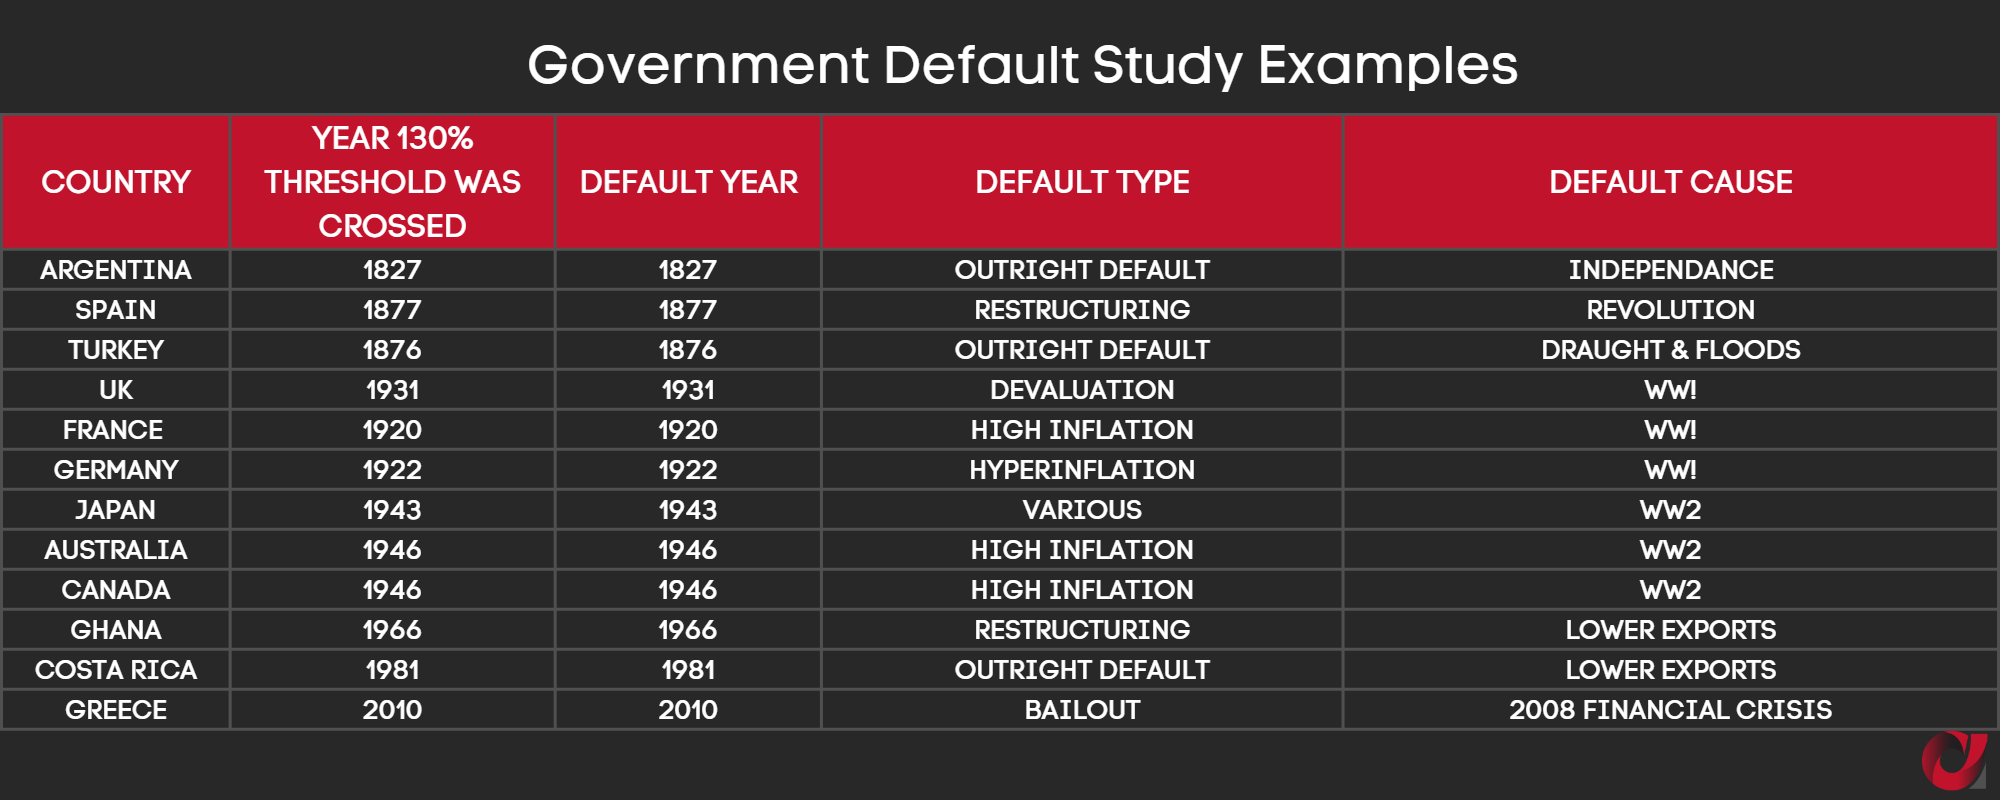
Talking of hindered economic growth is one thing. Entering the realm of country defaults is a different story. Another study conducted by Hirschmann Capital, with information taken since the 1800s, showed that 51 out of 52 countries that passed the 130% debt to GDP ratio, defaulted one way or another.


Table contents from Hirschmann Capital (Source: Reinhart & Rogoff, RIETI Japan, Bloomberg, HC Estimates)

So if countries today crossed the line by a longshot, why don’t we see them defaulting already?

To put things in perspective, a country will choose to default when the gains of not paying its debt exceed the cost of default. That is if the country has a choice. Here is a broad classification of defaults:

  • Disorderly default – “Violent”, with no time to prepare both for the banking sector or the citizens who are unable to react. Described by the collapse of all financial transactions, bankruptcy of banks and a steep increase in unemployment. Cyprus almost went through this back in 2013, if not for a bail-out program from the Eurogroup, the EU and the IMF of €10 billion, in exchange for impossible obligations (like tapping in people’s bank deposits).
  • Orderly default – Happens for the same reasons as the disorderly default, but this is a strategic choice of the country filing for it. There is a consensus reached between the lender and the borrower, with milder consequences to the economy and its people. It allows for a quicker comeback to the international markets. There is time to set things right unlike the disorderly default, and unemployment is much less severe.
  • Selective default – Partial default of payments and loans. Selecting to default on one or more obligations, but continue to pay some. In general, its characteristics are similar to the orderly bankruptcy.

Greece is an example of a country that defaulted as a result of the 2007 financial crisis, while other European countries facing similar numbers didn’t. Partial reasoning? the ability of a country to pay its debts relative to its ability to raise surpluses. Belgium and Italy as an example, were also hit by the crisis and had high debt ratios but were able to raise surpluses while Greece wasn’t. Another indication that economic output/production is imperative. A country consistently spending more than it earns, is on a downhill spiral. Passed the point of no return, odds are that a restructuring, devaluation, higher inflation or outright default is inevitable.

In the early 2000’s (which was also the beginning of the housing bubble), emerging markets were urged to take on credit from advanced countries to finance their operations. With very low interest rates to provide cheap money and attract borrowers, emerging markets jumped on the train to what they thought was the answer to their problems.


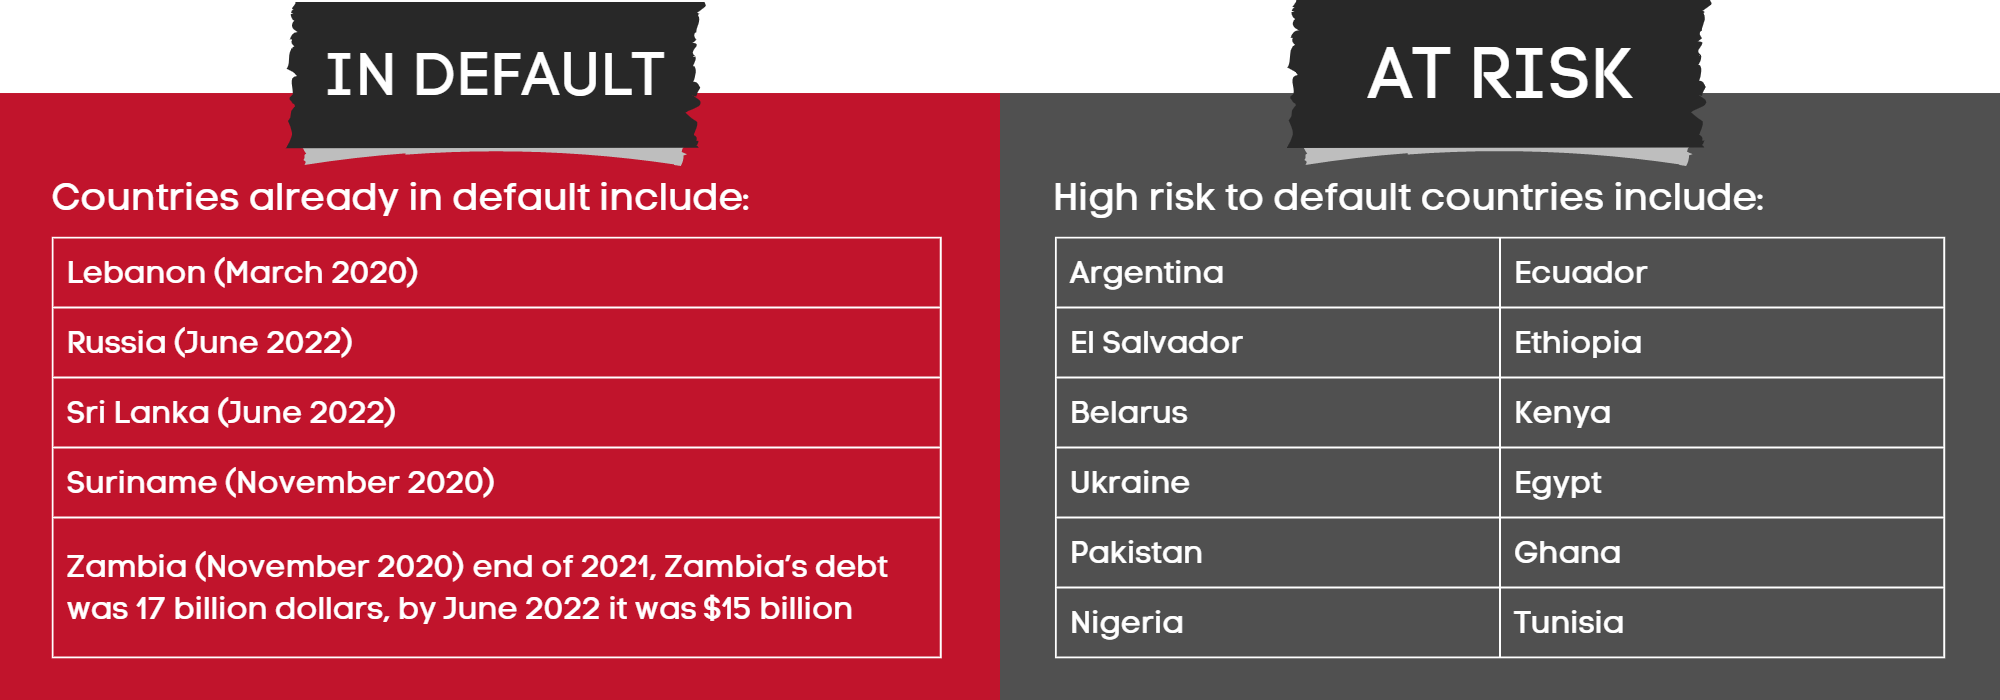
Taking Zambia as an example, the country is largely dependent on copper mining and rain-fed agricultural production. Zambia ranks 6th in the world in terms of Copper production (2nd in Africa after the Democratic Republic of Congo) and depends on weather to support its agriculture. Its external debt was so large relative to its output that it became unsustainable, and it became the first African country that defaulted on its payments during the pandemic.

Chinese creditors hold 1/3 of Zambia’s debt (or approximately $6 billion). The creditors include Industrial and Commercial Bank of China, Jiangxi Bank and China Minsheng Bank. Some say Zambia is a test case, with the world eyeballing how China handles debt restructuring as well as the precedent this case sets, for other countries in risk of default to follow.


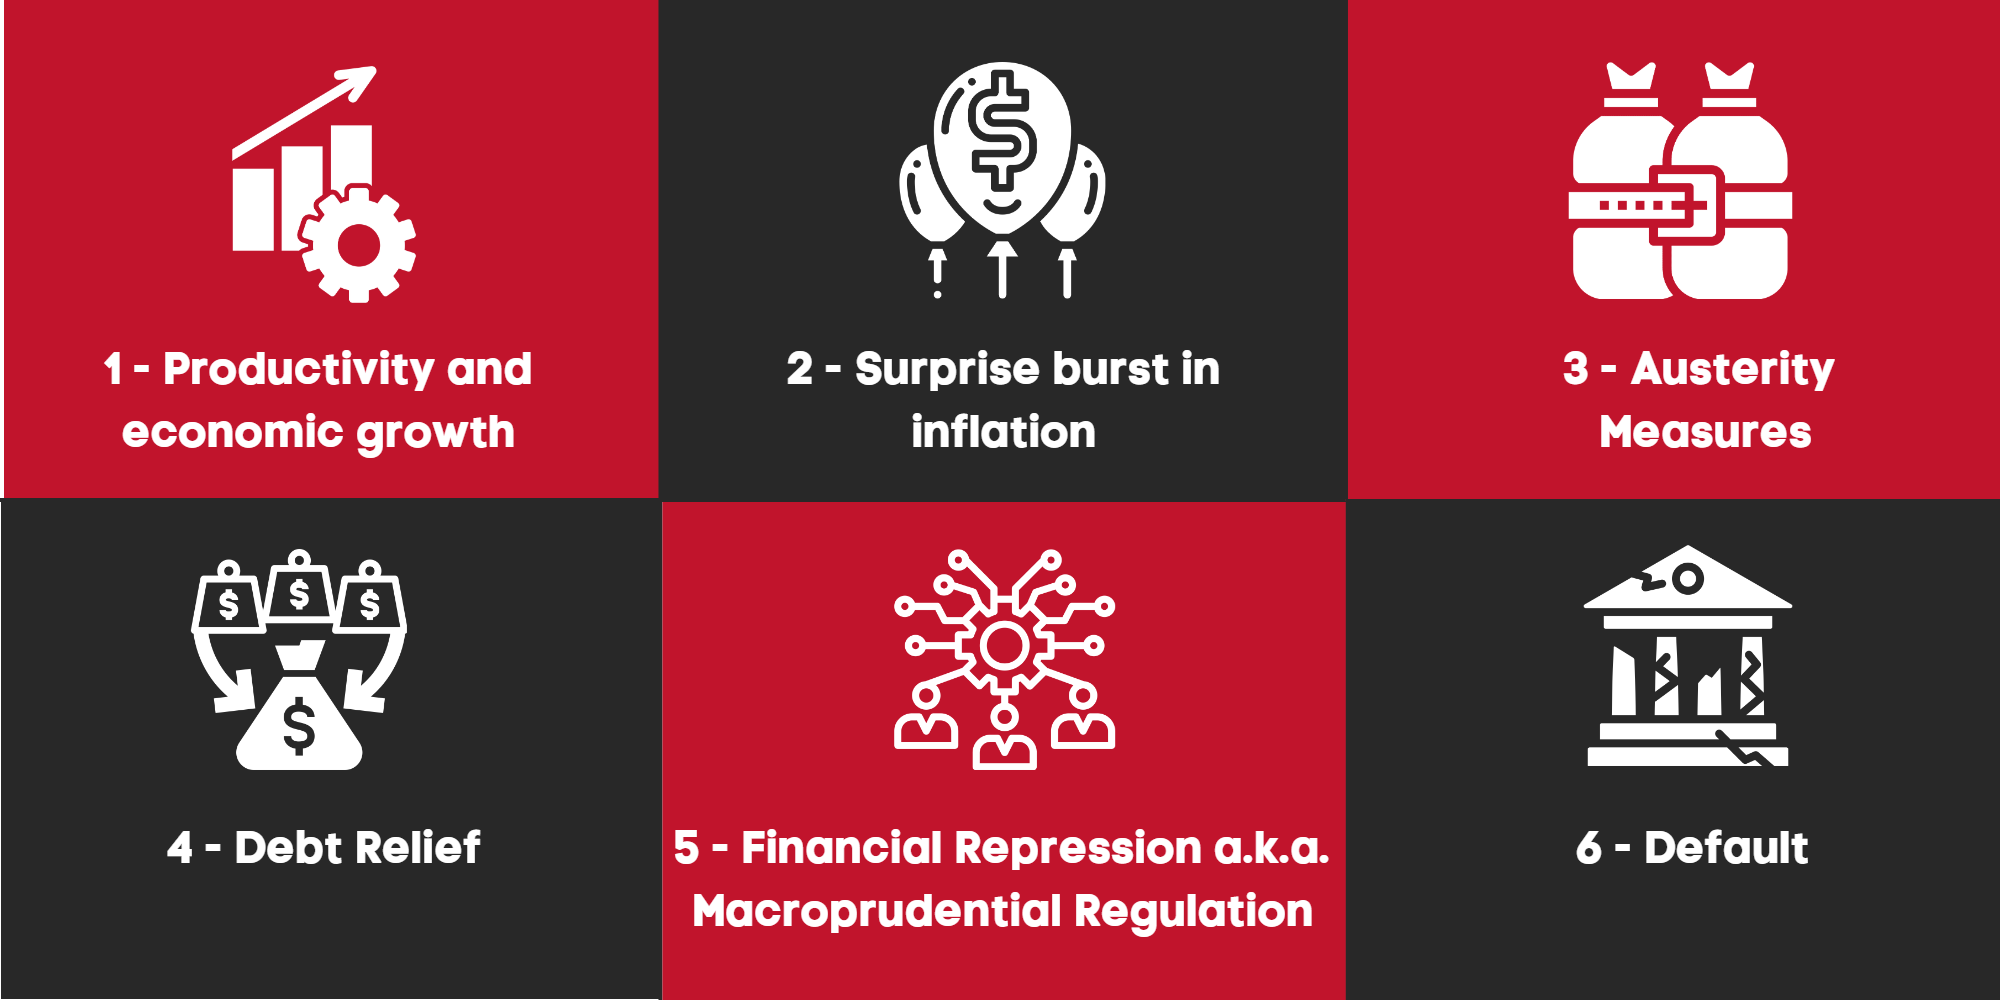
IMF among others, point out the following “remedies”, relative to lowering debt: 

  1. Productivity and economic growth – produce more than you spend or better yet, spend so that you can produce.
  2. Surprise burst in inflation – which reduces the nominal value of the debt and increases tax revenue due to higher prices.
  3. Austerity measures – Cut spending, increase taxes, accept any tomatoes thrown your way
  4. Debt relief – Debt restructure and gold revaluation maybe?*
  5. Financial Repression a.k.a. macroprudential regulation – government policies that redirect funds intended to go somewhere else, to the government. Helped countries reduce debt after the end of WW2 and is coming back due to the large amounts of current debt. It includes tighter connection between banks and government, pension funds/domestic banks lending the government, regulation of cross border capital moves, higher reserve requirements, prohibition of gold purchases (Gold Reserve Act of 1933).
  6. Default


*Is gold revaluation an option?


The term “gold revaluation” over the years fell victim to speculations and conspiracy theories. The outcome is a biased approach (depending on who benefits from such action and who loses). Not to be confused with the gold revaluation account held by central banks (where they can realize profits from the rise of gold price relative to the cost of buying it). Although related because, if you use gold revaluation to register unrealized gains and write off debt in your balance sheet, you’re in the foothills of a gold standard system. And if that’s the case and you check the relationship between money in circulation relative to the gold held in reserves (which is what the gold standard is suppose to do), you will find that the backing percentage is very low.

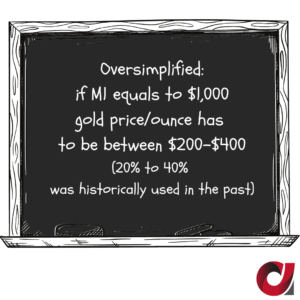
The gold revaluation we’re referring to, is mostly Rothbardian (see Murray Rothbard’s gold revaluation ideas) who popularized the possibility. Imagine returning to a gold standard system and fixing (pegging) the gold price per ounce, based on the quantity of gold central banks have in reserves relative to circulating money. Similar to 1933 in the US, when the government confiscated gold at the current price ($20.67 per ounce) and then immediately revaluated it to $35 per ounce (gold Reserve Act). Should the same concept happen today, from $1,800 it could reach anywhere between $10,000 to $50,000/ounce. Why? As explained by Jim Rickards, author of “The New Case for Gold” if the global gold reserves are 34,564 tons (as far as we know, since central banks don’t disclose the full numbers), to reach a peg of 20-40% of M1, you would need to price gold astronomically high. 40%? M1?

M1 is a measure of money supply (measuring from M0-M3). M1 is also known as narrow money, all the currencies and assets that can be easily converted into cash. The further you go on the M scale, the broader the money it measures and the less liquid (easily convertible to cash) the assets are. Rickards explained that 20-40% of M1 is historically a workable percentage used, when money was pegged to gold in the past (see image). The law in the US from early 1900s to 1950s said that gold price multiplied by the amount of gold in reserves had to amount to 40% of total money supply (Federal Reserve Act of 1913). Due to the Vietnam war and the need for money, they had to curtail the law, but 40% worked just fine. He also said that the Bank of England in the 1800s managed a successful gold standard when Britain became dominant power after the fall of Napoleon and until WW1 with 20% gold backing the money supply.

At $1,850/ounce, gold reserves relative to money supply is extremely low. If we consider M1 in the US hypothetically at $10T (with 8,000 tons of gold reserves), the gold is backing approx. only 4.75% of M1. The value of gold to back 40% of M1 would need to be approx. $15,600. If you take Rothbard’s approach of 100% backing, the value of gold should be approx. $39,000/ounce. What?


Here’s how it works out*:


M1 (hypothetically is 10 Trillion) / Tons (8,000) = $1,250,000,000 (Price per ton)

$1,250,000,000 (Price per ton) / 32,000 (Ounces per ton) = ~$39,000 (Price per ounce)

$39,000 (Price per ounce) x 40% = ~15,600 (Price per ounce)

At $1,850 (Current price of gold per ounce), backing is 4.75% (39,000 x 4.75%)

*For accurate calculations you will need to replace the hypothetical numbers with current ones. The above is meant to explain gold revaluation, and does not reflect our opinion on whether it is a viable strategy or not.

According to the World Gold Council 

Worldwide Total Gold Reserves by Region = 31,422.57 tonnes = 34,564.827 US tons 

  • America =  8,133.46 (North America) + 614.68 (South America) = 8,748.14 
  • Europe = 11,776.29 (Western Europe) + 3,433.59 (Central & Eastern Europe) = 15,209.88 
  • Asia = 3,332.62 (East Asia) + 878.72 (South Asia) + 809.30 (Central Asia) + 731.28 (South-East Asia) = 5,751.92 
  • Middle East, North Africa, Sub-Saharan Africa = 1,460.46 (Middle East & North Africa) + 172.28 (Sub-Saharan Africa) = 1,632.74 
  • Oceania = 79.89 


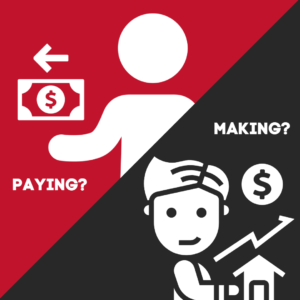
Last but not least, there is a reason credit/debt is not taught the way it should to youngsters in schools. Keeping the majority financially illiterate is the way to maintain and distribute wealth how the minority sees fit. You can be the person that gets a loan to buy a house to live in and have constant cash outflows, or the person that gets a loan to buy a house, then rents it to someone else and has cash inflows.

In one of Kiyosaki’s appearances, he mentioned that during the financial crisis the banks gave him tax free money (credit), somewhere around $300 million to buy property because they knew he would turn them into cash inflows. So where everyone was defaulting on their payments and losing their homes, he was finding dirt cheap properties that are now worth whatever they are worth, producing cash flow and making him even more rich. That’s $300 million out of $700 billion injected into Wall Street through the TARP program. Story for another day but think of how much wealth was produced from the left over $699.7 billion.

Debt/credit may not be as bad a your grandparents said it is. As long as you put it to good use.

The information provided is strictly for informational use and is not meant in any way to be construed as investment advice. One should seek expert advice, as all investment strategies involve risk of loss.


Start your Brokerage business by:

Connecting offshore: With our clients in Belize, Seychelles, the Caymans, Martial Islands and St. Vincent offering the most flexible IB and White Label solutions.

Connecting in the EU: With our clients in 15 out of the 28 member states offering strong partnerships to individuals and corporations with existing client base, looking to connect.

Contact us for a private conversation to discuss your case through the contact form or one of our emails at info@allfx–consult.com, partners@allfx-consult.com.

#startaforexbrokerage #ib #forex ib #whitelabel #forexwhitelabel #tied agent #regional partner #forexlicense #forexoffshorelicense


You might find this interesting

Capital Markets Training – for corporations and individuals

Forex White Label – Discover it all, requirements and options

EU Tied Agent – Should you consider it or not?

Forex jurisdictions – EU and Offshore with country stats and listed brokers

Reserve Currencies | Survival of the fittest

Yet another Munger word of wisdom on describing his perception of risk, was “show me where I’m going to die, so I’ll never go there”. A bit dark, but it fits quite well in introducing today’s discussion, since history does have a habit of repeating itself. And what better way to use history, if not to be able to anticipate the good, the bad and the ugly and act accordingly? You see, what we consider normal in our timeline, might be at the end of its own timeline in a much broader context. Given the shift in the balance of power among nations and their economies, this generation’s normal might now be due for a change. This article is a by-product of upcoming posts, that will outline and briefly look into the historical record of reserve currencies.

Why reserve currencies?

Because when there are major global developments, tensions, conflicts, wars, unexpected turmoil that might push down on the strong and lift up the rest, whispers of rising powers, who they might be and the chances of a change of scenery, are gaining ground. Possible shifts like this, imply a possible change in the global reserve currency as well. Or do they?

What are reserve currencies?

Held in large quantities by foreign central banks and major financial institutions, reserve currencies facilitate transactions, investments and given that global trade is measured in trillions, they make the world go round faster, relatively cheaper and most importantly safer.

Foreign exchange reserves are a way to meet foreign obligations, as well as appreciating a national currency when needed. A country uses its reserves to buy its own currency and increase its value when there is a risk of devaluation, so holding a substantial amount of foreign currency is the way to go.

The more demand for transactions in a specific currency, the more liquid it becomes. This provides easier access to capital for domestic firms since it can be acquired cheaper than it would, without the demand increasing its value. Other than the currency itself, investors tend to also hunt for securities denominated in the currency, like bonds that tend to be a safer bet in getting their investment back. Borrowing for the country becomes easier, allowing for investments, increased productivity, growth.

Important to note that with a strong currency, it becomes more expensive for foreign companies to buy a domestic product. It is also cheaper for domestic companies to buy foreign goods. By default then, imports increase and exports decrease, which raises the country’s trade deficit. A manageable downside though since an economy’s core doesn’t rely only on one variable.

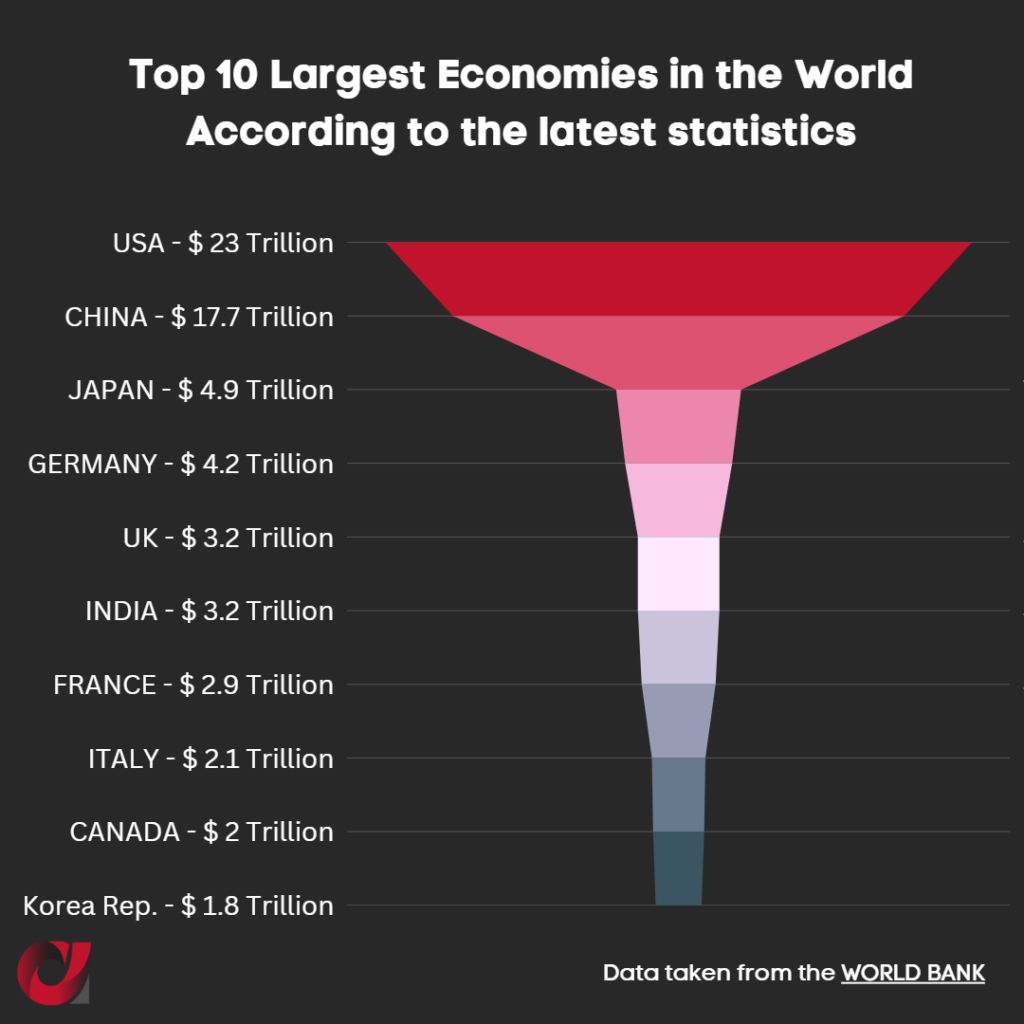
The larger and stronger an economy gets, the more interlinked it becomes to the global economy. According to the World Bank:

top 10 countriesWhen other sovereign nations are using your currency as their own, when over 65 countries peg their currency to yours, and when over 90% of forex trading involves your currency, you know you dominate. On the other side, when your GDP starts to decline at the same time that the GDP of competing countries is on the rise (with outlook of surpassing you) and/or when you are repositioned as a major partner in the global arena (EU exchanged more goods with other partners in 2021 compared to the US), you know that times might be changing.

Notwithstanding that the sanctions of the war in Ukraine, relative to the freezing of more than half a trillion dollars of Russian reserves, begs the question. Should a country hold all it’s eggs in one basket and be subject to economic paralysis if it doesn’t comply with everyone else’s decisions? This senseless war is an extreme case and the international community correctly took action but we’ve seen what people/countries would do, to protect their interests. Could the inward shift – becoming less dependent on global supply chains – be reflected on the currency reserves as well?

The USD global reserves peaked in the year 2000 at 70% (from 0% in early 1900) and had a 10% decline by 2021. Small increases in global reserves in EUR, GBP, JPY, CNY, AUD, CAD are taking portions of the 10% but nonsignificant to challenge the USD yet. History wants dominant countries and their reserve currencies, to hold that position for 100 years on average. If that’s true and the US took over Britain in 1920 (some argue it was during or after WW2 in the 1940s), then the US has held that position for 80-100 years already. Is the geopolitical scenery, the decline in GDP, the rise of the GDP of competing countries and this “average timer”, a signal for an upcoming change?

For thousands of years to the end of WW2 that saw an almost bankrupt Britain and a shift in dominance from the British pound to the United States and the US Dollar, countries and their currencies were fighting for the spot at the top of the podium. Breath in – the Byzantines and their solidus/hyperpyron gave way to the Italian Florin and Ducat, that briefly gave way to the Portuguese Real, followed by the Spanish Real and Spain’s colonial ambitions, who then gave way to the Dutch and their Guilder, who were pushed out by the French and their Livre, who lost to Britain and the British Pound who finally gave rise to the United States and the US Dollar – breathe out.

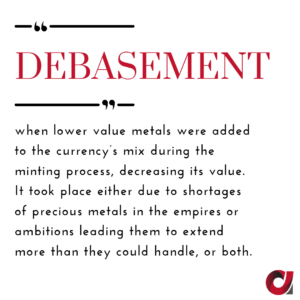
And in all of the above, the country standing at the top of the podium was constantly challenged leading to conflicts and wars, the necessary funding of these wars, retreats and abdications, debasement (see image) of the currencies, ultimately leading to the fall of one empire and the rise of another.

Debasement from what though?

From common metals like bronze and copper to precious metals like silver and gold, the mint (construction) was specific to the territory/country. The weight and the content of the metal varied and at times of scarcity, with the precious metal in the coin hardly recognizable.

Before we delve into the actual reserve currencies, their timelines, the significance of understanding what happened in the past to help us anticipate what might be coming in the future, here’s some conversation starters (or conversation enders depending on whom you ask)…

Barter was a system of exchange, that dates back thousands of years. Goods and services were exchanged for other goods and services, and that concluded a transaction. Simple.

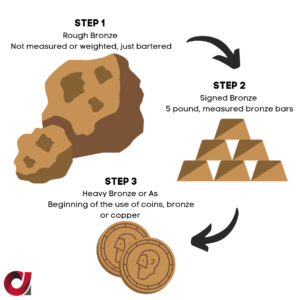
Metals (precious as well as common) were used for bartering. Going back to 200 BC as an example, Bronze was heavily used as a medium of exchange, not so much for its value, as much for its crafting qualities (easily turned into tools or something else). The evolution of Bronze as a medium of exchange can be seen in the following steps (see image)


We could go even further back to the Chinese, the Lydians, the Greeks and times where only agricultural products were used for trade. In our example though we can see clearly the evolution of first having a rough medium of exchange accepted for trade, to a more fair (measured and weighted) unit of the same, to an easier to handle, transport and store coin. Cattle, general livestock, or grain were messy, required care, maintenance, space. Metals were preferred because they lasted longer and could be easily stored or carried around for miles through the trade routes.

Trade routes at that time, were all land locked. Traders were still exploring to find safe passages and it wasn’t until approx. 110 BC that the Silk Route was established connecting China and Southeast Asia with Africa and Europe. Trade routes via sea, were recorded during the Age of Discovery/Age of Exploration. That was when European countries wanted to explore the world in the 1400s. It opened up a world of opportunities as well as brutal competition, which led to the discovery of the Americas as well as new trade routes to India and the Far East.

All of the above are characteristics of the evolution of the early trade to the monetary systems we understand today. From the minting of the coins, to their value outside the boundaries of the nation (since more precious metal content in the coin made it sought after for trade), allowed new empires to rise, on the demise of another.

Past a nation’s investment in itself i.e. innovations, technology, education (also required traits at older times), things remained the same relative to who’s on top. Productivity/output, competitiveness in global trade, military competences, and the recognition of currencies as reserve currencies declared the winner. Getting there is one thing, staying there is another. There’s an old saying “a bird in hand is worth two in the bush”. You should be content with what you have rather than risk losing it all for something bigger, which is what happened every single time. No risk, no reward though and this risk is what formed the world as we know it today.

So, what were the main attributes of the years 1200 onwards relative to global reserve currencies? How did empires rise and fall and what where the characteristics of their currencies? What is the relevance today and what lessons can we possibly learn from it?

Stay tuned! #foreignreserves #reserve_currencies

The information provided is strictly for informational use. It is not meant in any way to be construed as investment advice. One should seek expert advice, as all as investment strategies involve risk of loss.

____________________________________________________________________________________________

Lets look into all these together!

We discuss so much cool stuff during our Capital Market Training sessions. Thus enhancing our communication skills and allowing us to step into another level of personal achievement. This is not just another training session. It was made for Sales Teams to professionally communicate with their clients, but its now directed to anyone.

Find out more here – Capital Markets Training  

If it looks like a duck | an overview of the current state of affairs

Recession or no recession? It’s always a hit and miss, listening to the experts and their forecasts on what’s going on with the markets, and their take on how things should be run by the central banks and governments.

It’s also notable that people who sat on the chairman seat of a central bank, are people that once criticized their predecessors for doing what they thought correct.

Today they face the same criticism and “expert opinion” by everyone, maybe rightly so, maybe because of the pain felt while all markets tumble and fall.

  • If I bought 10 Apple stocks in August at a price of $174 (total of $1,740), at today’s price I would be losing $351
  • A fund that bought 4 million Apple stocks, would have paid $696 million, and would be losing $140 million
  • When tech stocks, chip stocks, media stocks, energy stocks, sector ETFs, sovereign bonds, all part of a portfolio are losing hundreds of millions of dollars each, it piles up and numbers can get scary. That’s when the blaming starts and questions like “data driven Fed, are you listening?” begins.

The IMF’s global economic outlook just came out, in part with reassuring elements of reading properly what central banks around the world are doing, but also with looming forecasted numbers of what to expect in the coming months and years.

According to their numbers, about a third of the world’s economies are facing 2 consecutive quarters of negative growth. That is the definition of recession. They also repeat that unlike your normal inflationary pressures of an overheating economy, external factors are the main drivers of the double-digit inflation we are experiencing in different parts of the world. A pandemic and its disruptions to the global supply chains, a senseless war and its disruptions to energy and food, geopolitical alliances and tensions, trade wars and embargos.

External, because under normal circumstances, inflationary pressures are caused by high demand and a low unemployment rate. Credit is more easily accessible through low interest rates, debt is increasing within its own expansionary/contractionary cycles, until the next central bank intervention, that will cool down the situation.

And although unemployment rates are indeed low and the spending power of people is strong thus requiring the said intervention, at the same time these external factors beg the question – can the central banks tame this newfound beast using the good old traditional ways?

To a certain extent the force is strong with the central banks but the fear and uncertainty of governments around the world, causes them to panic and overextend the tools they have in their disposal to fight. A central bank deals with monetary policies (money supply) while the government deals with fiscal policies (taxes and government spending). When the two try to steer a difficult situation at the same time, it’s like two people trying to drive a car with two steering wheels. It’s just not going to work.

A panic mode recently seen in the UK, which nearly caused a doom loop – when the price of sovereign bonds falls below a critical level and could destroy one of the biggest and oldest financial centres of the world. To fight the rising cost of living and the double-digit inflation, two policies came out. The first on September 8, was to cap the energy bill for a household at 2,500 pounds and would reportedly cost the government 70-100 billion pounds in the first year alone. It would be funded via bond issuance. The second on September 23, was to cut taxes of individuals and companies, also to be funded via government borrowing. Its cost was calculated at 45 billion pounds by 2027.

The tax cut announcement came a day after the 50 basis point rate hike. International markets panicked, investors lost faith in the GBP, and started a massive sell-off of assets denominated in the British Pound, while at the same time exchanging the currency for safer ones (like a strong dollar). On September 26, the British Pound hit a low of 1.03 against the dollar. When pension funds – that hold half of people’s savings – were getting margin calls and asked by the Investment Banks for more collateral on their leveraged positions, they also began a massive sale on their gilts (UK government bonds) to meet their obligations. With a rising supply and little demand, the market was already in a trajectory to disaster.

The Central Bank of England stepped in and promised to buy 65 billion worth of the supplied bonds to stabilize the market, until October 14th. Although it did prevent a doom cycle, money flew fast out of the FTSE as well. The government revised and stopped the tax cut plan but it goes to show that testing the markets has its limits.

Economists are debating whether what we’re dealing with, is an 80s Volcker situation all over again. Maybe it is, maybe not, but Paul Volker – the Fed chair at the time – was dealing with an inflation built-up over a period of +15 years following the Vietnam war, recessions, the Bretton Woods collapse, stagflation, a debt close to a trillion dollars (today’s debt is over $30 trillion) and much more. To put things in perspective, debt to GDP ratio was a little over 30% in the 80s, in contrast with over 120% today. In March 1980, inflation rate in the US was at 14.8% and interest rates were already high, in failing efforts to cool it down. Volcker raised the rates to 20% and engineered 2 recessions. It wasn’t until 1983 that inflation went down to 3%, that a period of growth had began for the US economy. Volcker was also booed and hissed for his brute-force – 20% interest rate is bound to cause a lot of pain – but today is regarded as a hero for many well-known investment advisors with billions in AuM.

Today, the Fed is dealing with hiking rates (already 5 times) from near zero, on a consecutive aggressive approach. Its dealing not only with a peaked, overheated economy but also with these external factors, all of which have an unpredicted future. Who knows when the war will end, what the world’s energy map will look like, what geopolitical effects on trade/tensions will be left behind?

Already tensions between countries are causing a turmoil to entire sectors. The second semiconductor US ban on China combined with hindered demand, has all stocks in the sector testing their lows. Most chip companies (and their clients like Apple and Microsoft) are listed on the S&P 500 and/or Nasdaq, bringing the indices down with them on a daily basis.

Similarly to Europe’s attempts to gain independence for its energy needs, China being dependent on global supply chains across the board will only push the rising giant to look how to internally complete the puzzles. China does have problems with a falling Yuan, the real estate sector (which takes up 20-25% of its GDP), the zero COVID policy restrictions that exert pressure on supply chains, and an aging demographic. Irrespective of the setbacks, with the Chinese government fighting corruption and its capital market reform, it’s still a superpower on the rise.

Deglobalization is now more alive than ever, since net exporters of valued products will first look inwards to support their own citizens, and then sell what’s available to the highest bidder. Opec + already proved that the cartel’s interests align with their profit, not with the households that will be affected by a 2-million-barrel supply cut. They already tasted the sweet $120+ per barrel earlier this year, why would they continue with an $80 price. And on that note, the United States SPR – Strategic Petroleum Reserve – is depleting while the eighth EU sanctions package is targeting even more Russian petroleum companies (as well as Russia’s manufacturing, aerospace, electronics, chemicals, crypto-asset wallets etc).

Closer to home, the EU is still trying to tackle with the Energy problems with Germany and the Netherlands pushing for joint gas purchases so that member states don’t outbid each other. The region is also evaluating caps on energy bills but with rational concerns raised by its members. Placing a cap on import increases fears of other regions around the world willing to pay more and outbidding the EU states. And what about increased demand? If the government is subsidizing a cap on my energy bill, I wouldn’t think twice to use more and it’s something that many would take advantage of.

Back to the IMF report, it considers that the war in Ukraine, the global higher cost of living from energy/food disruptions, and the slowdown in China are the main forces that currently push the markets in a volatile and fearful mode. We can measure how volatile and uncertain the market is through the “fear index”, CBOE’s VIX index currently above 30, indicating a level of extreme uncertainty. A level below 20 is what we would consider normal behavior. The three largest economies i.e. the United States, the EU and China are quote “going into a stall”.

The forecast looks into a stubborn global inflation peaking in late 2022 at 8.8% and dropping to 4.1% by 2024. That’s 2% above a country’s average target, but its also not a double digit, money hungry inflation rate. Hard to tell, but there’s some wishful thinking placed on the numbers, relative to how the external factors will settle around the globe and their aftermath.

The US dollar is keeping strong, affecting Emerging and Developing countries that hold debt in USD and find it difficult to pay their loans. Commodities are down, stock and bond markets are down around the world, secular (non-cyclical) sectors and cash are given more weight than they might deserve.

In all of this mayhem, investors are trying to guess the terminal rate, how long it will stay there and when the Fed will pivot. A crucial stage when fighting inflation because the terminal rate is when the Fed says enough, and its ready to test the theory by stopping the hikes and keeping interest rates at a level. When ready, it will loosen its tightening policy and start dropping the rates to boost growth and help stimulate the economy. If the rates drop too soon, it will push inflation back up and it might take a while before it corrects itself. If too late, the tight economy in a recessionary mode will take longer to recover.

The bond yield curve is already inverted. This means that the short term bonds are paying more than the long term bonds. Why? Under normal circumstances, bond holders get paid more interest if they buy long term maturity bonds due to the unpredictability of the long period. Short term pay less because they expire earlier. When there’s uncertainty in the markets, long term bond holders shift to short term bonds, causing the yield curve to flatten and then invert. If you can’t picture the chart, then think of the spread, the difference between the two yields. The closer the spread gets to 0, the flatter the curve. The second it goes below 0, you have an inverted curve.

Why is this important? Because inverted yield curves predicted every single recession over the years. If the inverted yield persists for a longer period, this would be yet another indicator that the economy is in a recession. Central banks take different maturities into consideration when looking at the yield curve, like the 2 year vs 10 year, or 2 year vs 30 year or an even shorter term like the 3 month T-bill.

Source: US Treasury

No alt text provided for this image

If it walks like a duck, sounds like a duck and looks like a duck, shouldn’t we call it a duck? The acknowledgement of a “very slight recession” in 2023 is either an understatement of what’s happening, or an overestimate of the ability of a person to actually recognize… a duck.

The information provided is strictly for informational use and is not meant in any way to be construed as investment advice. One should seek expert advice, as all as investment strategies involve risk of loss.

Generation Alpha & ESG investing

We might be a long way from an active Generation Alpha but in an increasingly turbulent world, it might pay to stay ahead of the curve. Born during or after 2010, Generation Alpha will be one of the largest “buyer pools” that will dominate the markets after Generation Z. With an expected 2+ billion people buying and selling by 2025 – and although currently very young – the trends of their likes/dislikes are already apparent.

Marketers are urged to take Generation Alpha’s characteristics into consideration from now when they create, market, and sell their products so that they find themselves at the right side (the buying side) of these “mini millennials”, when the time comes.


Some of the characteristics of Generation Alpha are:

  • Environmentally and socially conscious
  • Technologically savvy
  • Brand aware
  • Interactive/prefer to be part of an experience rather than be labelled “buyers


With that in mind, today’s topic will focus on the ESG side of investing which covers a great deal most of what Generation Alpha is conscious of. With one foot in a portfolio of assets and one foot out, ESG investing has been a matter of discussion and controversy among piers for years. Do corporations align their strategies with ESG standards as part of a smart marketing approach a.k.a. greenwashing? Do they bring up ESG only to cover for poor performance? Or do they really work towards making a positive impact?


What is ESG investing?

Looking into factors other than a company’s financials, when choosing your investment vehicles. ESG stands for Environmental (carbon footprint, water usage and waste, recycling), Social (employee training, customer service, social justice) and Governance (Board and management diversity, corruption, executive compensation) and it’s the result of various past attempts towards sustainable investing. Not taking enough steps towards sustainable investing, poses risks that although might not affect the short run, could expose a company to future threats. An ESG score/rating is assigned that indicates where a company stands in its ESG efforts.

In 2021, MSCI rated Microsoft with a AAA score (more on MSCI ratings below), the highest rating they can assign. Microsoft’s energy conservation efforts are admirable, with a target of 100% renewable energy use by 2025.


What is an ESG rating?

ESG ratings zoom-in to risks not considered when looking into a company’s financials. Operational and potential litigation costs are part of those risks.

MSCI ESG Research LLC, has been rating companies based on ESG characteristics since 1999. Their rating ranges from worse – CCC/B a.k.a Laggards – all the way to best – AAA/AA a.k.a. Leaders – with average ratings of BB,BBB, A. Other ESG rating companies are RobecoSAM, which was acquired by S&P Global at the end of 2019, Bloomberg ESG Disclosures, Moodys ESG Disclosures, Refinitiv, Sustainalytics ESG Risk Ratings and many more.

Companies with a high ESG score across the board (provided by more than 2 rating companies) include Microsoft, Taiwan Semiconductor, NVIDIA, Adobe. Average score examples across the board include Visa, Mastercard, LVMH (France).

Rating companies, score differently ESG efforts. For example LVMH – Luis Vuitton, a luxury goods conglomerate founded in 1923, gets Average scores by Refinitiv and MSCI but a very low score from Sustainalytics. Amazon gets excellent scores from Refinitiv but average from MSCI and Sustainalytics. All rating companies have a white paper outlining their methodology and investors can tap into them to get the information they need.


If ESG is a good thing, why the controversy?

With religious roots more than anything, the way of – Ethical Investing – attempted to keep people away from “wicked” assets that represented the likes of alcohol, tobacco, weapons, gambling etc. Socially Responsible Investing (SRI) became more prominent during the 70s and 80s as values-based negative screening basically told investors not to invest in a company that conflicts with their values.

As the Vietnam War came to an end, companies were still profiting from its after math. And as SRI investment pushes an industry rather than pull, religious investors steered clear from portfolios that profiteered from the war, continuing the ethical investment initiative.

The Pax World Balanced Fund provided an alternative investment vehicle and various movements/legislative acts went live relating to discrimination and environmental protection. Based on the Sullivan principles of supporting human rights, equal employment opportunities and social programs, from the year 2000 onwards ESG got more push by the United Nations who tried to integrate it into the Capital Markets.

Debates over the years relative to the social responsibility of companies date back to the 70s and include Milton Friedman’s “The social responsibility of business is to increase its profits”. A socially responsible act is one the corporate executive makes, not the business in its entirety. A socially responsible act would mean spending the money of the executive’s employers (shareholders) for a general social interest.

Examples in Friedman’s approach include spending large amounts of money to reduce pollution beyond the interest of the shareholders, hiring hardcore unemployed (hardcore: people jobless for a long time) rather than qualified personnel to help reduce poverty, refrain from raising product prices to help combat inflation (even if a rise is in the best interests of the business).

In all of the above examples, although the executive’s decision represents the business as a whole, spending someone else’s money for a general social interest might come in conflict with why the executive was hired in the first place. The employee acts as a civil servant although works (and is paid by) a private corporation whose interest, is maximizing returns.

According to a Harvard Business Review in March 2022 – referencing an analysis on Morningstar’s sustainability rating of more than 20,000 mutual funds – it was obvious that the highest rated funds attracted more capital, but none outperformed the lowest rated funds. Through studies they also found that to cover for earning’s underperformance, company executives often publicly talked about their focus on ESG (in contrast with overperforming results with little to no reference to ESG). An outright shoutout to investors, who might be investing in underperforming companies in an effort to support their ESG values. Last but not least, studies detected no improvement in ESG scores over a period of time indicating that the financial sacrifice funds potentially undertake for ESG investing, does little to nothing to improve the “wickedness” in the world.


Not all underperformers are created equal

NVIDIA is an example of a high ESG rated stock currently underperforming, but due for correction. A graphics processing unit (GPU) manufacturer, NVIDIA is a AAA rated company. Its GPUs are used for gaming, self-driving cars, and they power the fastest supercomputers in the US and EU. They are also used for mining crypto that use the PoW consensus protocol. Post the Ethereum Merge and the transition to PoS, a reported “unintended consequence” is the drop in sales of new GPUs, since the existing ones that powered the mining equipment will no longer be needed, and will flood the market with second hand/cheaper options.

Combined with US government restrictions on the company selling its A100/H100 products to China, it all resulted in a drop of NVIDIA’s stock price. Although due for a few challenging quarters, its an example of a AAA rated company, a leader in ESG standards that treats people fairly, socially conscious both internally and externally with its suppliers taking a hit nonetheless, ultimately affecting the returns of its shareholders.

That being said, investors are looking at the price drop as a way to enter rather than exit. Cathy Wood’s ARK Innovation Fund ETF sold a small portion of the fund’s Tesla shares in the beginning of the month, to fund a new purchase in NVIDIA ($32 million worth of it), after the sales restriction announcement and a +7% drop in its price.


What about other ETFs?

From $5 billion in 2006 to $378 billion in 2022, the allocation of assets with ESG standards to ETFs saw a significant rise. The largest Exchange Traded Fund in 2022 is SPDR Bloomberg SASB U.S. Corporate ESG UCITS ETF. Its size reached $6.75 billion. iShares ESG MSCI EM ETF reached $6.51 billion.

The question remains. If you have to choose between strong returns on your investment Vs doing something good i.e. ESG investing with less ROI, what would you choose? Sustainalytics research talks of a 40% – a significant percentage of investors choosing ESG investing and accepting a lower ROI. This leaves a 60% that is not willing to take a pay cut.

New information comes out daily regarding ESG investing. Major world events shaped the world as we know it today and people’s conscious efforts towards forging an even better one, generation to generation is a testament to how powerful connected voices can be. Mini millennials will inherit – a better or worse – world than their predecessors, and they are the future consumers/investors. Their exposure to technology from a young age, awareness of the environmental dangers, their pickiness in choosing the “right” brand, the social lessons they pick up from the world stage relating to discrimination, equality and human rights are in the core of what ESG is all about. Remains to be seen, what they’re willing to do with their superpower.

#minimillenials #genalpha #esginvesting #esg #futureinvestors

The information provided is strictly for informational use and is not meant in any way to be construed as investment advice. One should seek expert advice, as all as investment strategies involve risk of loss.

What’s the ECB anti-fragmentation tool? Especially considering what’s coming

Two of our articles last month, touched on inflation, interest rates and bonds. Inflation in the EU is counting down the days to hit double digits, and a 75 basis point hike on interest rates is imminent. What do we know happens to bond prices when interest rates go up (and aggressively so)? They drop like flies, and as a result of the fixed coupon rate, their yields rise. 

Why is this troublesome? High yields for a country’s bonds, means it has to pay more to borrow. In the case of Italy, with an already heavy debt load, the 4% on its – Buoni del Tesoro Poliennali (BTP) – 10 year yield, is a tough one to bear. The energy crisis is making things worse, pushing for more aggressive measures, and a tool that can take some of the yield pressure off, is seen as a good thing in the eyes of our policy makers. It’s a matter for debate but to each their own. 

When government bond yields of weaker economies relative to stronger ones rise, its known as fragmentation. It needs some intervention to relieve the pressure, a tool, an anti-fragmentation tool. 


Join our capital market training to learn what it all means


What does the past tell us? 

In the past (2009 onwards), the European Central Bank had a debt crisis to tackle. Member states were in over their heads and couldn’t pay their debts. Rumors had it (it was all over the news but we’ll call it rumors), exit from the Eurozone for some countries was a possibility. 

What’s Eurozone? All the EU states that adopted the Euro as their currency. So exit from the Eurozone, would mean moonwalking back to their own currency. Thriller, right? 

To deal with the crisis and prevent the Eurozone from breaking up, the Outright Monetary Transactions (OMT) tool was introduced in 2012, which taught us that “pari passu” means “on equal footing” among other things. 

The ECB would buy sovereign (government) short term bonds (1-3 year duration) – as many bonds as it took – from highly indebted member states to secure their stay in the Eurozone. To onboard themselves on this ship, the countries would need to enter the EU bailout programs, cut spending and raise taxes. Pari passu referred to the treatment the ECB purchases would receive if the countries defaulted on their payment. “On equal footing” with other bond holders, means they would stand to lose just as much if things went sideways. Desirable outcome? – To drive the price of the bonds up and reduce their yields.  

Under normal circumstances, central banks buy securities for quantitative easing. An open market operation, by which they flood a market (their own market) with money to stimulate the economy. 

In contrast, quantitative tightening aims to reduce money supply by selling securities (gives people “title deeds” and takes money off their hands) often accompanied by increasing interest rates to cool down an overheating economy. 

In the case of the OMT purchases though, stimulating the economy was not the plan. The money injected from the purchases could not stay in the economy. Therefore, these injections would have to be sterilized (raised eyebrow? it’s a real term). Sterilization happens when the ECB removes from circulation as much money as it injects. How? Through interest-bearing deposits parked with the ECB, of equal value as the bond purchases. This way money supply stays the same, while the goal for doing it in the first place is achieved. In this specific case, the goal was to drive bond prices up and lower their yields. See article on asset correlation for more information on bonds prices and yields. 

Another way for ECB to sterilize its money injections, would be to issue other bonds for banks to buy and remove money from circulation or sell other assets it holds of equal value. 

When OMT was introduced along with the famous “whatever it takes” Draghi statement, it calmed investors and Eurozone was back in business. So it was never actually used, but its very much alive and ready to deploy if needed today. 

A central bank is a strong player and although able to temporarily solve problems it can also make things worse further into the future. For example, its important to note that a central bank doesn’t only finance it’s projects or pays its bills with “hard cash”. It is also able to print money to fund its programs, which is something that they do, more often than you think. And although countries like the US or EU are in better condition to deal with the consequences of printing money than smaller economies, its still a dangerous play and in the words of Charlie Munger “if you print too much money it eventually causes terrible trouble and the rate at which countries are printing money, puts us in a new territory in terms of size”. 

It happened many times before in Europe, the US, Japan. Add in your search engine “Weimar Republic wheelbarrows of money” and look at the images that come up. Even with that much cash, people could only buy regular amounts of goodies because of hyperinflation that comes with printing money. 

What is hyperinflation? When prices of goods and services rise at an alarming rate, rendering money worthless. Think of too much money chasing too few goods. Take the example of the over-reported Zimbabwe. The country’s inflation percentages are too mind boggling to even write about. A good example though, of a country with stagflation – remember Stag from a past article? A country with rising prices and low output resulting in low tax revenues, attempting to finance higher spending by printing money, just because it can. We’ll delve more into this another time. 

Newest introduction to ECB’s toolbox – The Transmission Protection Instrument (TPI) 

The OMT description above pretty much describes the idea of the new tool with some obvious differences. Firstly it doesn’t require member states to apply for a bailout program although it does ask for sustainable spending/debt. Also TPI is more flexible since it can purchase longer maturity debt of up to 10 years (rather than 3 years under OMT). It can also purchase private securities. More on the TPI on EU press release here

Last but not least, in the middle of it all, the Pandemic Emergency Purchase Program (PEPP). Unlike the OMT that was never used, the PEPP was heavily pushed during the pandemic (heavily as in Euro 1.850 trillion). According to ECB, it started with €750 billion, raised it by €600 billion in June 2020 and by another €500 billion in December. 

Aggressive rate hikes will take place whether we like it or not. It’s good to know that sustainable tools exist to support the markets and more importantly, that they get better over time. Its apparent that just by knowing the cushion is there, it eases the troubled minds of investors who perform their acrobatics with a safety net. Whether the new tool will be used or not, it remains to be seen. 


About allFX-Consult

allFX-Consult is a capital markets consulting agency, catering to quality rather than quantity. For over a decade, our Directors have been connecting with some of the best individuals/professionals, service providers and brokers the industry has to offer so that we can meet any corporate challenge.

Our Capital Market Training is one of the most comprehensive training the industry has to offer.

Contact us for a private conversation to discuss your case through the contact form or one of our emails at info@allfx–consult.com, learn@allfx-consult.com.

You might find this interesting

Top EU and Offshore jurisdictions | Including brokers registered there & the country’s economic data 

Comprehensive list of worldwide regulators and supervising bodies

Understanding the nature of a Forex IB

The 13F form- how it gives insight to portfolio allocation

Stock markets and their listed companies form the backbone of every portfolio. We all have flashes, thoughts, jump scares, math done (crazy right?), to find the direction of company stocks. Like social trading though, that allows copying other traders who do the technical work for you, looking into professionally managed funds can also do the “leg work” of finding suitable buy/sell securities. That is, if you knew what their decisions entail.  

Even the best in the business get things wrong, and by no means do we imply that you should follow them down to the last detail. Even so, thorough research includes knowing what the “biggies” do as well. 

The US SEC requires Asset Managers with minimum $100 million in AuM (Assets under Management), to publicly disclose their holdings through a form called 13F. This form is filed every quarter and gives a sneak peek into the beautiful minds that run the largest funds in the world. It’s been reported that companies themselves sometimes rely on the 13F form to identify their shareholders. 

The form doesn’t include foreign company holdings and/or funds held under their holdings (whaat?). No, really, in the case of Berkshire Hathaway 13F filing (which is not a hedge fund or a mutual fund), you won’t see Gen Re’s fund called NEAM, with 178 holdings of their own (as of this Q report). You would need to search for New England Asset Management individually. 

Hedge funds are professionally managed pooled investments, that trade on liquid assets. They often use alternative investment strategies to try and outperform the markets like short selling, leverage, and derivatives. 

What is short selling? Borrowing an asset from a broker (interest and other charges vary per broker), selling it at its current price, and buying again at a lower price to profit from the difference. 

Example: Say you expect stock X to drop below $100. You borrow a number of stocks for $100 (with the associated interest/charges) and you sell. If the market drops as expected, you buy at the lower price and pay back the borrowed stocks. If the price rises though, there is theoretically unlimited risk since it can continue to rise and find a huge giant with a goose that lays golden eggs, and a harp etc. etc. (thumbs up if you know the reference). 

According to Wall Street Journal, Bridgewater’s hedge fund reported to be currently shorting European companies in a staggering +$7 billion. The shorted stocks are part of the Euro Stoxx 50. 

What are derivatives? A contract between two parties deriving its value from an underlying asset. Most common derivatives – we all know and love – are futures and options. Between Exchange Traded Derivatives and Over the Counter Derivatives, there are more types which we go through in our training sessions. 

Why referencing hedge funds? Because in today’s discussion we will take a sneak peek at 5 large funds through the eyes of the 13F form. We will use the form’s tool to compare Q1 and Q2 of 2022 and get a closer look at the largest buy/sells that they performed Q on Q. For the complete list of their holdings you’ll need to do a small research of your own. We just wanted to shed some light to the form, irrespective of the fund names or their positions. 

At the end we will also include Warren Buffet’s – Berkshire Hathaway – quarter comparison as well, just because the man is a legend (as mentioned the company is not a hedge fund or a mutual fund). He is the reason many are in this business, some richer than others but who’s counting?  

Notes 

  1. Funds are randomly picked. 
  1. The sample lists are sorted by the largest number of shares bought and sold. 
  1. Under CL, the share’s class type is mentioned. Each company defines the characteristic of its share classes as they see fit in their charter. (with voting rights or not, dividend payment terms and so on) 
  1. Terms like spon/sponsored ADS or spon/sponsored ADR refer to American Depository shares/receipts 
  1. ADRs are securities of foreign companies listed on US stock exchanges. They are issued by a depository bank, to represent a foreign company’s publicly traded securities. It is how investors can get access to developed or emerging markets. See our article on diversification for information on developed/emerging markets. 
  1. Sponsored ADRs are issued with the participation/blessing of the foreign company. Unsponsored ADRs are candles in the wind. 


BlackRock Inc. Q1 2022 vs. Q2 2022 13F Holdings Comparison 

Sym  Issuer Name  Cl (stock class)  Q1 2022  Q2 2022  Diff  Chg % 
AMZN  AMAZON COM INC  COM  29,143,882  587,459,057  558,315,175  1916% 
WBD  WARNER BROS DISCOVERY INC  COM SER A  0  166,503,034  166,503,034  NEW 
FTNT  FORTINET INC  COM  11,561,432  52,869,973  41,308,541  357% 
VICI  VICI PPTYS INC  COM  58,176,039  95,846,408  37,670,369  65% 
WISH  CONTEXTLOGIC INC  COM CL A  6,402,156  37,770,689  31,368,533  490% 
             
TXMD  THERAPEUTICSMD INC  COM  24,442,512  0  -24,442,512  -100% 
DISCK  DISCOVERY INC  COM SER C  24,909,437  0  -24,909,437  -100% 
TNXP  TONIX PHARMACEUTICALS HLDG C  COM  34,392,362  0  -34,392,362  -100% 
ISBC  INVESTORS BANCORP INC NEW  COM  35,715,997  0  -35,715,997  -100% 
MFA  MFA FINL INC  COM  35,786,123  0  -35,786,123  -100% 
PBCT  PEOPLES UNITED FINANCIAL INC  COM  36,670,981  0  -36,670,981  -100% 
ZNGA  ZYNGA INC  CL A  45,215,373  0  -45,215,373  -100% 
IVR  INVESCO MORTGAGE CAPITAL INC  COM  55,516,956  0  -55,516,956  -100% 
EDU  NEW ORIENTAL ED & TECHNOLOGY  SPON ADR  64,329,110  0  -64,329,110  -100% 


Bridgewater Associates, LP Q1 2022 vs. Q2 2022 13F Holdings Comparison 

Sym  Issuer Name  Cl (stock class)  Q1 2022  Q2 2022  Diff  Chg % 
F  FORD MTR CO DEL  COM  2,199,950  4,620,739  2,420,789  110% 
WBD  WARNER BROS DISCOVERY INC  COM SER A  0  2,213,889  2,213,889  NEW 
WETF  WISDOMTREE INVTS INC  COM  156,132  2,201,350  2,045,218  1310% 
CVS  CVS HEALTH CORP  COM  1,210,917  3,146,236  1,935,319  160% 
CVE  CENOVUS ENERGY INC  COM  557,544  1,969,127  1,411,583  253% 
  NEW ORIENTAL ED TECHNOLOGY  SPON ADR  0  1,360,704  1,360,704  NEW 
T  AT&T INC  COM  2,047,133  3,393,604  1,346,471  66% 
SWN  SOUTHWESTERN ENERGY CO  COM  0  1,196,019  1,196,019  NEW 
PYPL  PAYPAL HLDGS INC  COM  114,312  1,267,329  1,153,017  1009% 
             
GLD  SPDR GOLD TR  GOLD SHS  2,107,996  1,306,455  -801,541  -38% 
IAU  ISHARES GOLD TR  ISHARES NEW  3,353,019  2,369,514  -983,505  -29% 
BILI  BILIBILI INC  SPONS ADS REP Z  1,099,588  0  -1,099,588  -100% 
KO  COCA COLA CO  COM  11,937,821  10,820,759  -1,117,062  -9% 
FXI  ISHARES TR  CHINA LGCAP ETF  3,276,798  1,612,109  -1,664,689  -51% 
JD  JD.COM INC  SPON ADR CL A  2,141,206  0  -2,141,206  -100% 
EDU  NEW ORIENTAL ED & TECHNOLOGY  SPON ADR  6,201,032  0  -6,201,032  -100% 
VWO  VANGUARD INTL EQUITY INDEX F  FTSE EMR MKT ETF  22,717,958  15,432,241  -7,285,717  -32% 
BABA  ALIBABA GROUP HLDG LTD  SPONSORED ADS  7,480,545  0  -7,480,545  -100% 
DIDI  DIDI GLOBAL INC  SPONSORED ADS  8,149,902  0  -8,149,902  -100% 
EEM  ISHARES TR  MSCI EMG MKT ETF  19,621,771  1,435,298  -18,186,473  -93% 


Renaissance Technologies Llc Q1 2022 vs. Q2 2022 13F Holdings Comparison 

Sym  Issuer Name  Cl (stock class)  Q1 2022  Q2 2022  Diffference  Chg % 
SWN  SOUTHWESTERN ENERGY CO  COM  1,035,725  33,712,025  32,676,300  3155% 
XELA  EXELA TECHNOLOGIES INC  COM NEW  17,755  15,865,037  15,847,282  89255% 
PLTR  PALANTIR TECHNOLOGIES INC  CL A  12,514,847  28,204,147  15,689,300  125% 
SHOP  SHOPIFY INC  CL A  0  14,036,600  14,036,600  NEW 
NIO  NIO INC  SPON ADS  5,401,600  17,768,900  12,367,300  229% 
             
VZ  VERIZON COMMUNICATIONS INC  COM  10,604,493  64,100  -10,540,393  -99% 
PBR  PETROLEO BRASILEIRO SA PETRO  SPONSORED ADR  16,782,600  5,155,000  -11,627,600  -69% 
TNXP  TONIX PHARMACEUTICALS HLDG C  COM  19,200,435  0  -19,200,435  -100% 
ITUB  ITAU UNIBANCO HLDG S A  SPON ADR REP PFD  20,872,374  0  -20,872,374  -100% 
EDU  NEW ORIENTAL ED & TECHNOLOGY  SPON ADR  37,490,100  0  -37,490,100  -100% 


Tiger Global Management Llc Q1 2022 vs. Q2 2022 13F Holdings Comparison 

The fund managed $90 billion in assets at its peak, with tech stocks surging in 2021 amid the pandemic. According to Reuters though, the fund lost billions of dollars (approx. 50% in the first half of the year). Many of the shares it sold rebounded on Nasdaq’s +18% rally in the current quarter. 

Sym  Issuer Name  Cl (stock class)  Q1 2022  Q2 2022  Difference  Chg % 
IOT  SAMSARA INC  COM CL A  0  4,649,140  4,649,140  NEW 
BZ  KANZHUN LIMITED  SPONSORED ADS  7,280,575  11,655,423  4,374,848  60% 
S  SENTINELONE INC  CL A  5,909,855  10,010,610  4,100,755  69% 
AMZN  AMAZON COM INC  COM  147,743  2,613,800  2,466,057  1669% 
TOST  TOAST INC  CL A  12,672,463  14,693,414  2,020,951  16% 
             
EMBK  EMBARK TECHNOLOGY INC  COM  21,293,320  9,917,027  -11,376,293  -53% 
DDL  DINGDONG CAYMAN LTD  ADS  12,141,140  118,539  -12,022,601  -99% 
JD  JD.COM INC  SPON ADR CL A  48,774,995  30,525,661  -18,249,334  -37% 
IS  IRONSOURCE LTD  CL A ORD SHS  20,500,000  0  -20,500,000  -100% 
NU  NU HLDGS LTD  ORD SHS CL A  254,788,564  203,013,206  -51,775,358  -20% 


Aqr Capital Management Llc Q1 2022 vs. Q2 2022 13F Holdings Comparison 

Symbol  Issuer Name  Cl (stock class)  Q1 2022  Q2 2022  Difference  Chg % 
QRTEA  QURATE RETAIL INC  COM SER A  6,824,857  16,753,914  9,929,057  146% 
VTRS  VIATRIS INC  COM  3,898,552  10,095,801  6,197,249  159% 
ENDP  ENDO INTL PLC  SHS  1,264,412  6,394,925  5,130,513  406% 
T  AT&T INC  COM  4,579,612  8,286,499  3,706,887  81% 
GILD  GILEAD SCIENCES INC  COM  2,712,026  6,095,793  3,383,767  125% 
             
F  FORD MTR CO DEL  COM  4,423,873  2,627,116  -1,796,757  -41% 
HMY  HARMONY GOLD MINING CO LTD  SPONSORED ADR  2,206,767  320,022  -1,886,745  -85% 
KMI  KINDER MORGAN INC DEL  COM  2,891,688  714,750  -2,176,938  -75% 
INFY  INFOSYS LTD  SPONSORED ADR  6,044,325  1,016,971  -5,027,354  -83% 
VALE  VALE S A  SPONSORED ADS  9,142,394  3,132,350  -6,010,044  -66% 


And last but not least, here’s BRK: 

Berkshire Hathaway Inc Q1 2022 vs. Q2 2022 13F Holdings Comparison 

Sym  Issuer Name  Cl (stock class)  Q1 2022  Q2 2022  Diff  Chg % 
OXY  OCCIDENTAL PETE CORP  COM  136,373,000  158,549,729  22,176,729  16% 
ALLY  ALLY FINL INC  COM  8,969,420  30,000,000  21,030,580  235% 
AMZN  AMAZON COM INC  COM  533,300  10,666,000  10,132,700  1900% 
VIAC  PARAMOUNT GLOBAL  CLASS B COM  68,947,760  78,421,645  9,473,885  14% 
ATVI  ACTIVISION BLIZZARD INC  COM  64,315,222  68,401,150  4,085,928  6% 
AAPL  APPLE INC  COM  890,923,410  894,802,319  3,878,909  0% 
CVX  CHEVRON CORP NEW  COM  159,178,117  161,440,149  2,262,032  1% 
CE  CELANESE CORP DEL  COM  7,880,998  9,156,714  1,275,716  16% 
MCK  MCKESSON CORP  COM  2,921,975  3,198,344  276,369  10% 
MKL  MARKEL CORP  COM  420,293  467,611  47,318  11% 
             
VZ  VERIZON COMMUNICATIONS INC  COM  1,380,111  0  -1,380,111  -100% 
RPRX  ROYALTY PHARMA PLC  SHS CLASS A  1,496,372  0  -1,496,372  -100% 
KR  KROGER CO  COM  57,985,263  52,437,295  -5,547,968  -10% 
USB  US BANCORP DEL  COM NEW  126,417,887  119,805,135  -6,612,752  -5% 
STOR  STORE CAP CORP  COM  14,754,811  6,928,413  -7,826,398  -53% 
GM  GENERAL MTRS CO  COM  62,045,847  52,877,359  -9,168,488  -15% 


There is no European equivalent form to the 13F that we know of. In the UK (for listed companies) the filings relate to shareholding percentages above 3%, with each percentage threshold of 1% (4,5,6 – 100%), to be disclosed to the exchange and the company itself. If the shareholding percentage falls below 3%, one last disclosure needs to be submitted until (if) the threshold is passed again. For non listed companies, the thresholds are different. 


Start your Brokerage business by:

Connecting offshore: With our clients in Belize, Seychelles, the Caymans, Martial Islands and St. Vincent offering the most flexible IB and White Label solutions.

Connecting in the EU: With our clients in 15 out of the 28 member states offering strong partnerships to individuals and corporations with existing client base, looking to connect.

Contact us for a private conversation to discuss your case through the contact form or one of our emails at info@allfx–consult.com, partners@allfx-consult.com.

#startaforexbrokerage #ib #forex ib #whitelabel #forexwhitelabel #tied agent #regional partner #forexlicense #forexoffshorelicense
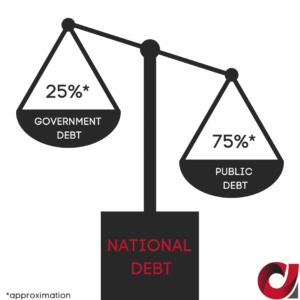


You might find this interesting

Capital Markets Training – for corporations and individuals

Forex White Label – Discover it all, requirements and options

EU Tied Agent – Should you consider it or not?

Forex jurisdictions – EU and Offshore with country stats and listed brokers


Building up to the Merge | Bite-sized piece

Building up to the Merge | Bite-sized piece

Keeping it simple – What, when, how, why 


What – The Merge is Ethereum’s transition from Proof of Work to Proof of Stake consensus protocol. The transition involves the launch of the Beacon Chain (went live in December 2020), the Merge (case in point) and the Shard Chains which will come in later to improve the network’s scalability.

Shards? Think of 12 people standing on top of each other. The one at the bottom can hold the rest, but the weight is causing some neck & back problems. Now split them up from 1 person holding 11, to 6 holding 2 or more people. Less pain, more gain.

In the case of Ethereum’s blockchain, it’s currently a single chain that holds all the network’s transactions in consecutive blocks. The sharding upgrade will break down the large database, into smaller, manageable pieces (64 to be exact). Combined with rollups (packaging many transactions in a single one and submitting it to the chain as one) reduces the data required for a transaction.

How does it improve scalability? If the network can handle thousands of transactions per second (TPS), it can serve a huge amount of users improving congestion and usage spikes.

When – EST. mid September, 2022

How – As mainnet (ETH 1.0) gets merged with the Beacon Chain the entire transactional history of Ethereum will be merged with it. The PoW model will be completely abandoned and the Beacon Chain’s PoS will be the only producer of new blocks.

gas fees

Why – To improve Ethereum’s sustainability as it currently requires vast amounts of energy for validation. It will reduce its requirements by 99.95%. It would be great if gas fees and transaction speeds got better as well, but this won’t be the case with the Merge.

Gas fees? The cost of a transaction on the Ethereum blockchain. After the London upgrade last year, the cost is derived from multiplying {the base fee (cost of gas) + optional tip} by the transaction cost.

Why do gas fees need improvement? Because as the network got more congested, these costs increased exponentially. Especially after the massive interest in NFTs. A user can’t always wait for low peak times to make a transaction (which kinda’ sorta’ fixes the problem), so improving the overall structure would be great.

Ethereum, PRE – MERGE


Ethereum (ETH) went live in 2015 to record transactions and facilitate smart contracts.

smart contract

What is a Smart Contract?  Contracts (programs) that exist (created and validated) in the blockchain’s network. After their addition to the blockchain, they are enforced by the network. No need for a third-party enforcement i.e. lawyer or bouncer.

The Ethereum platform has been extensively used for Initial Coin Offerings (ICO boom of 2017), where new tokens are launched using the ERC standard.

ERC – Ethereum Request for Comment is a standardized document with rules that Ethereum based tokens must comply with. Programmers use the ERC to write Smart Contracts on the Ethereum blockchain. The community then reviews and comments on it through the EIP.

EIP – Ethereum Improvement Proposal – the comments of the community. Once received, the developers revise and implement accordingly.

hard fork

Example of EIP 1559 during last year’s London hard fork. It split the transaction fee that used to be directed to the miners, to a base fee + tip. The base fee gets burned (removed from circulation by the network) while the tip goes to the miners. The base fee is algorithmically calculated based on network congestion. If many transactions are fighting to be included in a block, the base fee will be higher.

Note: The EIP 1559 (burning) combined with the PoS upgrade (the Merge), will reduce Ether supply by more than 80%. The event is known as triple-halving.

What is halving (as we know from Bitcoin)? When the reward for Bitcoin is halved or cut in half. So triple-halving for Ethereum, is like halving Bitcoin 3 times.

The issue of new Ether will drop significantly, the burning through the EIP1559 and the staking of Ethereum to be eligible to validate (which can’t be withdrawn for at least 6 months after the Merge) will see a huge Ethereum supply drop. Increased demand combined with decreased supply, has speculators targeting a $5,000 breach. Ethereum already came close to this target in 2021, when it climbed up to $4,800 after major updates (Berlin and Uniswap) and the sale of Beeble’s NFT for a staggering $69.3 million (Pak’s NFT “The Merge” sold for $91.8 million in December of 2021).

ERC standards in a nutshell

  • ERC20 – standard used to create fungible assets (resembling fiat currency). ERC20 tokens have a fixed supply, and they are transferrable. Some remained on the Ethereum blockchain while others jumped on their own blockchain (example of Binance and Tron).
  • ERC721 – standard used to create NFTs (non-fungible, each token is unique). Allows transfer only of individual NFTs, not in batches.
  • ERC1155 – standard (introduced in 2019) that allows mixed use of fungible and non-fungible tokens. Single smart contracts can support multiple functions i.e., user can send coins (fungible) and weapons, mascots, art (non-fungible) in one transaction.
  • ERC777 – standard used to create fungible assets like ERC20 but allows for more complex interactions when trading tokens. When tokens are sent to a contract, a function (called hook) is activated that allows sending tokens to a contract and notifying the contract in a single transaction (unlike ERC-20, which requires two transactions (approve / transferFrom).the merge

Birth of Ethereum Classic. ETC was born after the DAO hack in 2016 – set of smart contracts for a Decentralized Autonomous Organization. DAO was a venture fund (high risk/high reward investment pool). Its investors had voting rights on the assets that the fund would invest in. It raised millions of $ worth of ETH, a third of which was hacked and stolen.

The community proposed to hard fork ETH to restore stolen funds. Some refused. After a vote in 2016, Ethereum was hard forked to Ethereum Classic (ETC).


To place the size of these two in perspective, analyzing the numbers today (11/08/2022)

  • ETH trades at $1,853 with a market cap at $227.3 billion
  • ETC trades at $40 with a market cap at $5.5 billion

Transition phase – Ethereum transactions are currently validated through the PoW (Proof of Work) consensus protocol. Just like Bitcoin.

Quick facts about PoW: It requires advanced equipment and vast amount of electricity to solve complex equations. The better the equipment, the faster the complex equation can be solved – unfair match? Wasteful and vulnerable to attacks (51% attack – mining pools that control more than 50% of the mining hash rate). Mining pools defy the main purpose of why blockchain technology is a step forward for us all, which is decentralization.

What is hash rate? Total computational power used by the network to process blockchain transactions. In essence, how many calculations can be performed per second.

The next step in Ethereum’s evolution is the transition from PoW to Proof of Stake (PoS) consensus. PoS has a more random selection. Participants (nodes) stake their assets. Dishonest validations means losing one’s stake and reward. Some algorithmic activity finalizes the choice of validators as well (like coin age base selection where a forger’s coin age is reset to 0 after forging a new block, and a waiting time of 30 days is needed to be selected again).

Fast forward to December 2020, Ethereum 2.0 went live initiating (phase 0) of PoW to PoS transition. Ethereum 2.0 chain is called the Beacon Chain. ETH 1.0 and ETH 2.0 exist side by side until they Merge together.

One of Ethereum’s test networks called Goerli, ran a final test on August 11, 2022. It simulated the process that Ethereum will go through in September. The test validated the reduced energy requirements, and that the merger process works.

The world is now counting down the remaining time to the Merge.

Investors don’t need to do anything before or after the Merge. Ethereum.org warns against scams with the disclaimer “you should be on high alert for scams trying to take advantage of users during this transition. Do not send your ETH anywhere in an attempt to “upgrade to ETH2.” There is no “ETH2” token, and there is nothing more you need to do for your funds to remain safe”

Original article published on www.allfx-consult.com

#carbonfootprint #ethereum #themerge #eth #etc #sharding #capitalmarket #capitalmarkettraining #decentralized

The information provided is strictly for informational use and is not meant in any way to be construed as investment advice. One should seek expert advice, as all investment strategies involve risk of loss.

Portfolio Allocation & Asset Relationships

Setting up a correct portfolio of assets is almost as hard as being convinced to “invest” rather than “just spend”. It’s debatable if everyone knows the potential benefits of investing vs. the dark pit of spending and how the potential outweighs the risk.

Many investment firms (in the front line of educating people) are a long way from becoming proper advocates of the spend/invest association, but today, we will be looking into a different type of relationship. That of asset correlation and why its relevant when setting up an investment portfolio.

Correlations are not constant as they change in different environments. Depending on inflationary/deflationary pressures or high/low economic growth, what we know as normal is anything but normal. We look into all of them in our training sessions, but examples of such changes happen with stocks and bonds or stocks and crypto assets.

What is positive, negative and neutral correlation?

Positive – when two subjects move in the same direction.

Negative – when two subjects move in the opposite direction.

Neutral – when there is no correlation between the two subjects

A statistic is used to indicate the relationship from -1 to 1, with 1 indicating positive correlation. Any number closer to 0, is in limbo.

Why is asset correlation important? 

Because a basic principle of a risk mitigated portfolio is diversification. According to the biggest asset managers, a portfolio is not diversified by investing in assets that perform the same during certain market conditions (positively correlated). It’s diversified by holding negatively correlated assets with proper allocation percentages. In a job well done, it will probably do better on a good day than lousy on a bad day, which is still proportionately positive and vice versa. portfolio

Other than holding negatively correlated assets, one also needs to account for predictability vs unpredictability. Think of insurance on your car. You pay a premium you might not need to exercise within the year but when required, it secures you from higher costs and painful bills. A portfolio is setup with a similar goal in mind. It will include assets that are expected to have a higher return but also assets that safeguard against downturns and unexpected moves. Knowing the current asset correlation can be valuable, especially if you’re prone to shock related heart conditions or passing out.

The most well-known strategy is the 60/40 portfolio allocation. 60% investment in stocks and a 40% investment in bonds. In times of economic expansion, stock markets are expected to produce higher returns and investors tend to prefer them more than fixed income (bonds). Bonds provide a cushion during economic contractions or recessionary environments due to their predictability and relative stability.

In different environments where inflationary or deflationary pressures are dominating, the correlations change. A build up of inflationary pressures like a pandemic or war (not your average cost-push or demand-pull inflation) is a good example of a positive correlation between bonds and stocks. Bonds rise first, then stocks tend to follow. The 10-year treasury is said to be a good indicator. Example of the 90s all the way to the Dot Com bubble at which point stocks and bonds parted ways (also known as decoupling, when deflationary pressures started building up. Investors were taking funds out of stocks and investing in bonds).

  • Not all bonds are created equal. From junk bonds to investment grade and everything in between, there are risks to factor in before the purchase. Bond maturity also plays a role, since from a T-bill’s less-than-a-year duration, to a 30 year bond’s duration, a lot can happen in an economy within the 30 year unpredictable gap.
  • An economic contraction doesn’t push investors completely out of stocks. It calls for a more defensive approach – hence the term defensive stocks like utilities/staples (two out of eleven sectors that categorize shock absorbing stocks), or even blue chip. portfolio
  • Cash is king (or is it?). Another defensive approach (more like a sitting duck or a babe-in-the-woods) is cash. Does sitting on a bank account with inflation eating cash like a very hungry caterpillar, make for a strong defense?

Spring chicken vs old geezer. 

Its increasingly reported that the crypto/stock markets are mostly uncorrelated. Especially when countries don’t kill each other, and masks are not covering our faces from virus-covered projectiles (too much??) Under healthier conditions of prosperity, the crypto world has its own Alfred to drive it around (even for the majority of 2021, during pandemic). All assets were pushed around by your average forces, while bitcoin was doing its own thing.

Fast forward to now, and a correlation of +0.6 indicates a strong positive relationship when things are anything but normal. It’s only a matter of time before the two markets become uncorrelated again but what does this mean for portfolio diversification using bitcoin? Right now, not so useful as you can imagine.

Correlations between indicators and assets – Example of interest rates and bond prices

During economic contractions, central banks lower interest rates to boost economic growth and make borrowing cheaper.

  • When interest rates drop, the bond prices go up because they pay better interest (coupon) than the current rate and all newly issued bonds.
  • The relationship is inverse (one down, one up). They are said to be negatively correlated
  • Bond yields, are also negatively correlated to bond prices. The reason is that interest paid on bonds is fixed. The bond price though, is fluctuating.
  • Dividing the fixed coupon with a higher bond price, will produce a lower yield
  • Dividing the fixed coupon with a lower bond price, will produce a higher yield
  • Both points above, stipulate a positive correlation between interest rates and bond yields.

Correlations like these are used frequently by analysts in their effort to get as close to making a correct choice, as many times as possible. Nothing is set in stone, reading the markets can be a hit-and-miss game.

#diversification #assetrelationships #stocks #bonds #crypto #capitalmarkets

Visit us at www.allfx-consult.com

The information provided is strictly for informational use and is not meant in any way to be construed as investment advice. One should seek expert advice, as all investment strategies involve risk of loss.